Introduction: The Quietest Revolution in the Workplace
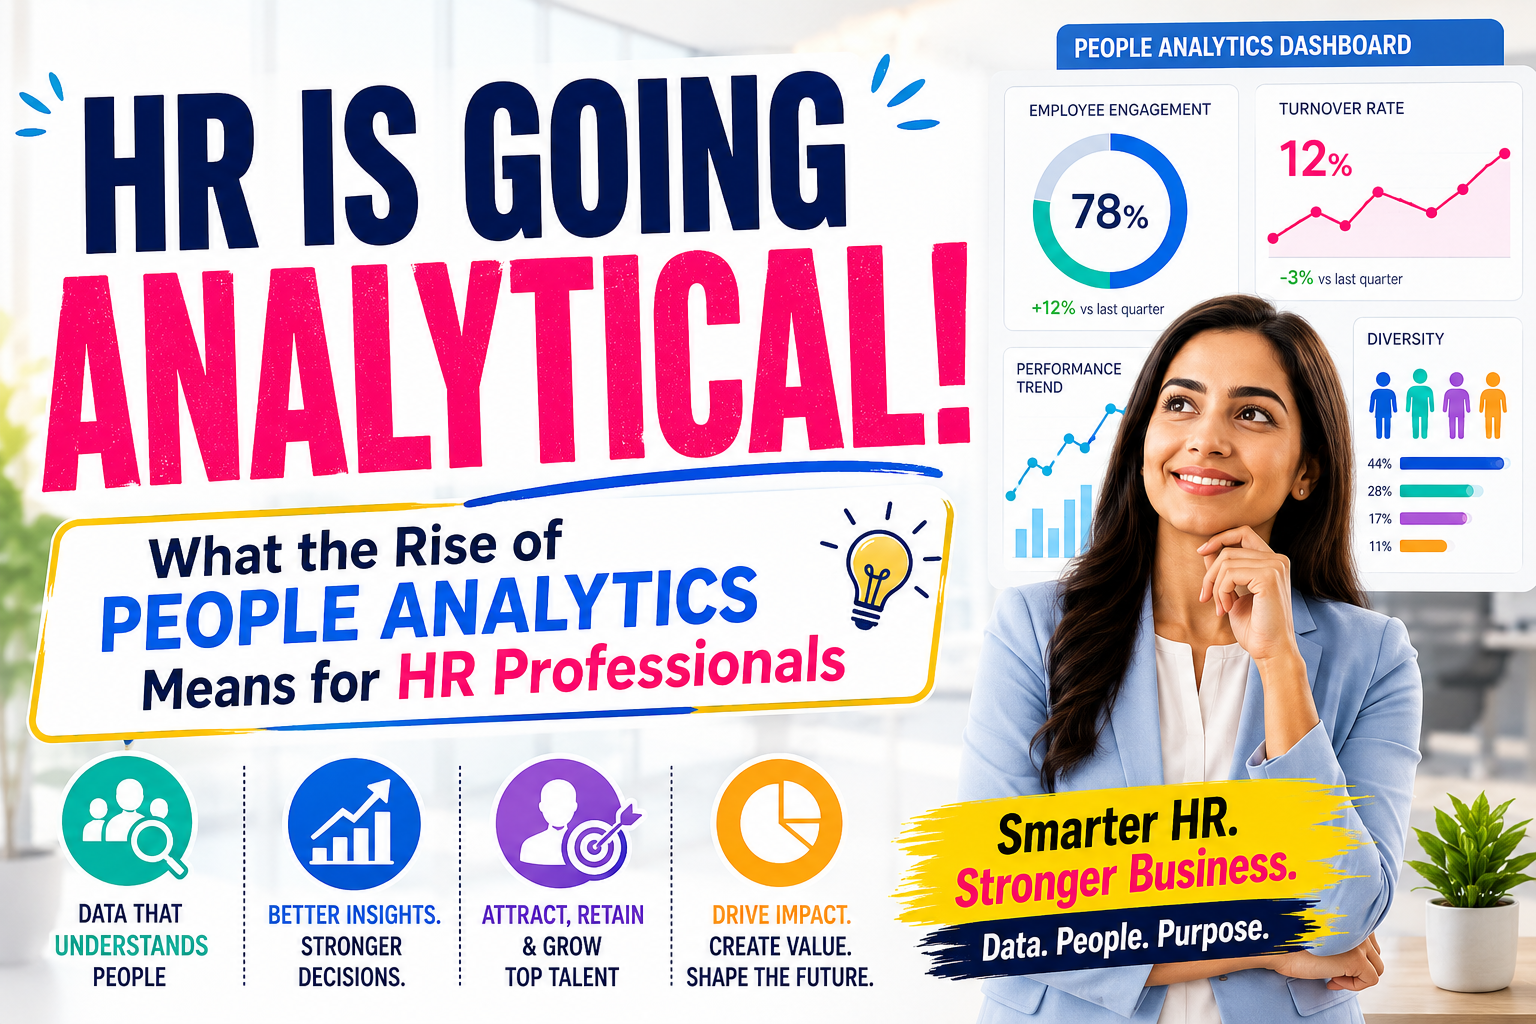
Walk into almost any HR department today, and you’ll notice something that would have looked out of place ten years ago: dashboards. Turnover heat maps. Engagement trend lines. Hiring funnel conversion rates broken down by source and recruiters. A decade ago, the most sophisticated tool in many HR offices was a well-organized spreadsheet and a gut feeling built on years of experience. Today, that gut feeling is still valuable — but it’s expected to show up with evidence. This shift has a name: people analytics, sometimes called HR analytics, workforce analytics, or talent analytics depending on who’s writing the job description. And it isn’t a fad.
According to McKinsey’s 2025 HR Monitor, which benchmarks HR practices across organizations in multiple countries, HR functions are being measured less on activity and more on outcomes — retention, hiring quality, productivity, and the strategic contribution of people decisions to business results. Deloitte’s 2025 Global Human Capital Trends research, drawn from more than 13,000 business and HR leaders across 93 countries, frames this moment as one where organizations must balance stability with agility while artificial intelligence reshapes how work actually gets done.
If you’re an HR professional reading this, you’ve probably already felt the pull. Maybe your CHRO asked for a “data story” behind a hiring plan instead of just a headcount request. Maybe your CFO wants to know the ROI of your latest engagement survey. Maybe you’ve been handed a Power BI dashboard and told, gently but firmly, that it’s now part of your job to understand it. Whatever your entry point, the message is the same: HR is going analytical, and the professionals who learn to work comfortably with data are the ones who will shape the function’s future.
This article is a deep, practical walkthrough of that shift. We’ll cover where people analytics came from, what it actually is (and isn’t), why organizations are pouring money into it, and how it plays out across every major HR discipline — from workforce planning to succession planning to compensation to DEI. We’ll also spend real time on the parts most “intro to HR analytics” content skips: the ethics, the implementation traps, the myths, and the very real question of how an HR generalist — not a data scientist — can build genuine fluency with data without needing a statistics degree.
Consider this your field guide. Let’s start at the beginning.
From Gut Feel to Data-Driven — The Evolution of HR
The Administrative Era
For most of the twentieth century, HR (or “personnel,” as it was long called) was fundamentally a record-keeping function. Payroll, compliance, benefits administration, and employee files were the core of the job. Decisions about who to hire, promote, or let go were made almost entirely on judgment — a manager’s instinct, a reference check, a gut sense of “fit.” There was very little systematic measurement of whether any of it worked.
The Strategic HR Era
Starting in the 1980s and accelerating through the 1990s, HR began positioning itself as a “strategic partner” to the business — a phrase that, frankly, became something of a cliché precisely because it was said far more often than it was proven. HR leaders wanted a seat at the executive table, but they often lacked the evidence to back up the claims they were making about their own value.
The Digitization Era
The 2000s and early 2010s brought HRIS platforms, applicant tracking systems, and eventually cloud-based HCM suites like Workday, SAP SuccessFactors, and Oracle HCM. This mattered enormously — not because software alone creates insight, but because it created something HR had never really had at scale: clean, structured, centralized data about people. You can’t analyze what you can’t measure, and for the first time, HR teams had systems capturing tenure, performance ratings, compensation history, learning completions, and mobility patterns in one place instead of scattered across paper files and disconnected spreadsheets.
The Analytics Era
This is where we are now. It’s not just that the data exists — it’s that organizations have built the muscle (and increasingly, the AI-powered tools) actually to use it. People analytics teams have gone from a handful of pioneering companies like Google (whose famous “Project Oxygen” used data to identify the behaviors of effective managers) to a mainstream capability that Gartner, Deloitte, and McKinsey all treat as a standard pillar of a modern HR function.
What’s driving the acceleration now, specifically, is the collision of three forces:
- Cloud HR systems that make workforce data accessible and exportable rather than trapped in silos.
- AI and machine learning, which can find patterns in that data far faster than any human analyst, and increasingly explain what they find in plain language.
- Business pressure for accountability — CFOs and boards asking HR to justify spend on talent the same way they’d scrutinize marketing spend or supply chain investment.
Deloitte’s 2025 research captures a related tension well: organizations are trying to balance “stagility” — the need for stability that most workers say they want, against the agility that leaders believe the business requires. Analytics is, in many ways, the mechanism organizations are using to manage that tension: it lets them make faster decisions without abandoning rigor entirely.
Key takeaway: People analytics isn’t a new department bolted onto HR. It’s the natural next stage of an evolution that started with record-keeping and is now arriving at evidence-based decision-making.
What is People Analytics?
Let’s clear up some confusion, because the term gets used loosely.
People analytics is the practice of collecting, analyzing, and applying workforce data to improve decisions about hiring, developing, managing, and retaining employees — with the explicit goal of improving both business outcomes and employee experience. It sits at the intersection of HR expertise, statistics, and organizational psychology.
It is not the same as:
- HR reporting, which describes what happened (headcount last quarter, turnover last year) without necessarily explaining why or predicting what’s next.
- HR technology, which is the infrastructure (your HRIS, your ATS, your LMS) that generates and stores the data — but a shiny system alone doesn’t produce insight.
- Data science, which is a technical discipline. People analytics borrows data science methods but is applied, business-facing, and grounded in HR judgment, not just modeling accuracy.
The Four Levels of Analytics Maturity
Most consulting frameworks (Deloitte’s, Gartner’s, and academic versions alike) describe a similar progression. It’s worth understanding because it tells you where your own organization probably sits — and it’s rarely as advanced as leadership assumes.
| Level | Name | What It Answers | Example |
|---|---|---|---|
| 1 | Descriptive Analytics | What happened? | “Our turnover was 14% last year.” |
| 2 | Diagnostic Analytics | Why did it happen? | “Turnover was highest among 1–2 year tenure employees in Sales, correlated with manager change.” |
| 3 | Predictive Analytics | What’s likely to happen next? | “These 40 employees have an elevated flight-risk score in the next 90 days.” |
| 4 | Prescriptive Analytics | What should we do about it? | “Targeted retention conversations and a compensation review for this segment would reduce projected attrition by an estimated X%.” |
Research aggregated by industry analysts in 2025–2026 suggests the vast majority of organizations still operate primarily at Levels 1 and 2. One widely cited industry analysis found that while a strong majority of organizations report having some form of HR analytics in place, only a small single-digit percentage have reached true predictive maturity — and those that do report outsized returns, in the range of several times the ROI of less mature programs. That gap between ambition and capability is one of the defining features of the field right now, and it’s exactly why HR professionals who can move a team even one level up the maturity curve are so valuable.
Myth vs. Reality
| Myth | Reality |
|---|---|
| “People analytics means turning HR into a spreadsheet.” | Good people analytics makes qualitative judgment sharper, not obsolete — it tells you where to look, not what to feel. |
| “You need a PhD in statistics to do this work.” | Most day-to-day people analytics work is applied statistics at a level any HR professional can learn — averages, trends, correlations, simple regression, and increasingly, AI tools that do the heavy lifting. |
| “More data automatically means better decisions.” | Poor-quality, biased, or misapplied data produces confidently wrong answers. Data quality and question framing matter more than data volume. |
| “Predictive models replace manager judgment.” | The strongest implementations pair a model’s flag with a manager or HRBP’s contextual read — the algorithm surfaces the signal, a human interprets it. |
| “Analytics is only for large enterprises with big budgets.” | Mid-sized organizations increasingly get powerful analytics bundled directly into their existing HRIS or payroll platform at no extra build cost. |
Why Organizations are Investing — The Business Case
It’s worth being honest about what’s actually driving budget approval, because it’s rarely “data for data’s sake.”
1. Cost pressure and accountability – Talent is usually an organization’s largest controllable cost. When finance leaders ask HR to justify spend, “we believe in our people strategy” doesn’t satisfy a board. A quantified story does.
2. The hiring-and-retention math has gotten harder – McKinsey’s 2025 HR Monitor Survey, based on benchmarking across European organizations, found that offer acceptance rates sit at just 56% in the countries studied, that 18% of new hires leave during their probationary period, and that overall hiring success — from requisition to a retained hire — stands at only around 46%. Numbers like that turn recruitment from an art project into a leak that needs measuring and plugging.
3. AI adoption has made analytics faster and cheaper to build – SHRM’s 2025 Talent Trends research found that AI adoption for HR tasks climbed to 43% in 2025, up from 26% the year before — a sign that the tooling barrier that used to make analytics expensive is coming down fast.
4. Leadership genuinely believes in the payoff – Industry benchmarking research circulating in 2025–2026 (aggregating results attributed to McKinsey-style people analytics studies) found that organizations using people analytics extensively are roughly three times more likely to achieve strong talent-acquisition performance than those that don’t, and that mature analytics functions are several times more likely to make fast, confident decisions and to outperform competitors on core business metrics.
5. The market itself is voting with its wallet – Independent research on the HR technology market — a 2026 analysis from 451 Research/S&P Global — found that people analytics, talent intelligence, and employee experience are now the fastest-growing segments of a roughly $94 billion global HR technology market, outpacing legacy administrative HR systems.
A Quick Business Case Framework You Can Reuse
When you’re pitching a people analytics investment internally, tie it to one of these four value levers — vague appeals to “insight” rarely survive a budget review:
- Cost avoidance (reduced attrition, reduced mis-hires, reduced overtime/agency spend)
- Revenue enablement (faster time-to-productivity, better sales talent placement, capacity planning that avoids missed deals)
- Risk reduction (pay equity exposure, compliance, succession gaps in critical roles)
- Speed and agility (faster hiring decisions, faster restructuring response, faster skills redeployment)
Mini case in point: Unilever has been cited repeatedly in workforce-analytics research for using predictive analytics and cross-channel recruitment data to identify and correct bias points in its hiring funnel — using data not just to hire faster, but to build a demonstrably more diverse pipeline, backed by feedback loops from its internal channels. The lesson generalizes: the highest-value analytics use cases are usually not the flashiest dashboards, but the ones tied to a specific, expensive business problem.
The Technology Engine — AI, Automation, Cloud HR, and Predictive Analytics
You can’t talk about people analytics in 2026 without talking about the technology stack underneath it, because the stack has changed faster in the last three years than in the previous fifteen.
Cloud HR Systems: The Foundation
Modern HCM platforms (Workday, SAP SuccessFactors, Oracle HCM, UKG, ADP, and others) are the plumbing. They centralize employee data that used to live in silos — payroll here, performance there, learning somewhere else — into a single structured environment. Without this foundation, none of the analytics layered on top works reliably, because you’d be reconciling data from five disconnected systems before you could even start analyzing anything.
Automation
Robotic process automation and workflow automation handle the repetitive, rules-based tasks — onboarding paperwork, leave approvals, standard reporting — freeing HR capacity for higher-value analytical and advisory work. ADP’s 2026 HR trends research notes that organizations are increasingly deploying “agentic AI” — systems that don’t just automate a single task but can interpret context and execute multi-step workflows, with CHROs projecting substantial growth in this kind of agent adoption over the next couple of years.
Predictive and Prescriptive Analytics
This is where machine learning models are trained on historical workforce data to forecast outcomes — who’s likely to leave, which candidates are likely to succeed, where skills gaps will emerge. The technique has matured well beyond the early “one-size-fits-all turnover model” era into more nuanced, explainable approaches. Recent academic research on attrition modeling emphasizes a growing push toward explainable AI (XAI) in HR — models that don’t just output a risk score, but show the manager why an employee is flagged, so the output can be acted on responsibly rather than treated as an unquestionable verdict.
Generative and Agentic AI
The newest layer, and the one moving fastest. Microsoft’s 2026 Work Trend Index — based on trillions of anonymized Microsoft 365 productivity signals and a survey of 20,000 knowledge workers across ten countries — found that nearly half of all AI interactions with tools like Copilot now involve cognitive work such as analysis and creative problem-solving, not just drafting text. For HR specifically, that means generative AI is increasingly being used to summarize open-ended survey comments, draft job descriptions, synthesize performance feedback, and even model “what if” workforce scenarios in natural language rather than requiring a dashboard build.
But the same research contains an important caution for HR leaders: Microsoft found that only a minority of workers — around one in five — are operating as true “frontier” AI users getting transformative results, while the rest are still experimenting at the edges. The gap isn’t really about access to tools anymore; it’s about organizational design, training, and trust. That’s a people problem before it’s a technology problem — which is precisely HR’s territory.
A Simple Way to Think About the Stack
| Layer | What It Does | HR’s Role |
|---|---|---|
| Data foundation (cloud HRIS) | Stores clean, structured workforce data | Ensure data quality, governance, single source of truth |
| Descriptive/BI layer (Power BI, Tableau, native HRIS dashboards) | Visualizes what’s happening | Interpret trends, ask better questions of the data |
| Predictive/ML layer | Forecasts outcomes (attrition, hiring success) | Validate model logic, ensure fairness, translate output into action |
| Generative/Agentic AI layer | Automates tasks, summarizes, assists in decisions | Set guardrails, keep humans in the loop, own the judgment call |
Key takeaway: Technology is the enabler, not the strategy. The organizations getting real value aren’t the ones with the most expensive tools — they’re the ones that paired the tools with clear questions, clean data, and disciplined follow-through.
Workforce Planning and Forecasting
Workforce planning used to mean building next year’s headcount budget in a spreadsheet. Strategic workforce planning is a different discipline entirely — and it’s one where analytics maturity varies enormously across organizations.
McKinsey’s HR Monitor research distinguishes three types of workforce planning:
- Operational workforce planning — short-term staffing forecasts, roughly a year out.
- Strategic workforce planning (SWP) — a three-to-five-year view aligned to business strategy and scenario planning.
- Skills-based SWP — planning around the skills an organization will need, rather than fixed roles, which is increasingly the more relevant lens as AI reshapes job content.
Here’s the uncomfortable finding: while 73% of organizations surveyed by McKinsey conduct some form of full operational workforce planning, very few connect that planning to future skill needs, and in the United States, only about 12% of HR leaders report doing strategic workforce planning with a genuine three-year-plus horizon. Most organizations are, in effect, planning for next year while claiming to plan for the future.
A Practical Workforce Planning Framework
- Start with the business plan, not the org chart. What does the business intend to do in the next 12–36 months, and what capabilities does that require?
- Segment your workforce by criticality, not just headcount — identify roles where a vacancy or skills gap creates real business risk (versus roles that are important but replaceable).
- Build supply and demand scenarios. Supply: attrition trends, retirement eligibility, internal mobility pipelines. Demand: growth plans, automation impact, new capability requirements.
- Model at least two scenarios — a baseline and a stretch/contraction case — rather than a single point forecast, given how quickly conditions shift.
- Translate the gap into action: build (L&D), buy (hire), borrow (contractors/gig), bot (automate), or bridge (redeploy internally).
Common Mistakes in Workforce Planning
- Planning headcount in isolation from skills — leading to “enough people, wrong capabilities.”
- Treating the plan as an annual event instead of a living model updated quarterly.
- Ignoring internal supply (who could move into critical roles) and defaulting to external hiring by habit.
- Failing to connect workforce plans to finance’s headcount and budget models, creating two competing “truths.”
Recruitment Analytics and Talent Acquisition Metrics
Recruiting is where people analytics often starts, because the data is relatively clean, the ROI is easy to demonstrate, and the pain (unfilled roles, slow hiring, bad hires) is visible to everyone.
Core Talent Acquisition KPI Table
| Metric | What It Tells You | Healthy Benchmark Signal |
|---|---|---|
| Time-to-fill | Days from requisition open to offer accept | Trending down, without sacrificing quality |
| Time-to-hire | Days from candidate application to offer accept | Shorter often correlates with better candidate experience |
| Offer acceptance rate | % of offers accepted | McKinsey’s 2025 benchmark: ~56% across countries studied — a useful reference point |
| Quality of hire | Performance/retention of hires at 6–12 months | The single most important, and most under-measured, TA metric |
| Source of hire effectiveness | Which channels produce hires who stay and perform | Should shift budget away from high-volume, low-quality sources |
| Cost-per-hire | Total recruiting spend / hires made | Useful for budgeting, less useful alone for quality decisions |
| New-hire attrition (first 90 days/1 year) | % of hires who leave early | McKinsey found 18% leave during probation in the countries studied — a red flag if your number is materially higher |
| Diversity of slate and hire | Representation at each funnel stage | Reveals where the funnel narrows, not just the final outcome |
AI in Recruiting
SHRM’s 2025 Talent Trends research found that 69% of HR professionals now use AI to support recruiting, up sharply from 51% the year before — making recruiting one of the most AI-saturated corners of HR. Common applications include resume screening and matching, chatbot-based candidate engagement, interview scheduling automation, and increasingly, predictive modeling of which candidates are statistically likely to succeed and stay.
That said, this is also the area where bias risk is most scrutinized (more on that in Part 14), because a biased screening algorithm can silently filter out qualified candidates from underrepresented groups at scale, long before a human recruiter ever sees a resume.
A Recruiting Funnel Diagnostic Checklist
- [ ] Where in the funnel is the biggest drop-off — applications to screen, screen to interview, interview to offer, or offer to accept?
- [ ] Does time-to-fill vary significantly by department or hiring manager — and if so, is that a process issue or a manager coaching issue?
- [ ] Are your highest-volume sourcing channels also your highest-quality channels, or are you optimizing for volume at the expense of retention?
- [ ] Does your diversity representation narrow at a specific funnel stage (e.g., a strong diverse applicant pool that thins dramatically at interview)?
- [ ] Is quality-of-hire actually being tracked past the first 90 days, or does measurement stop at “filled the role”?
Employee Engagement Analytics
Engagement measurement has evolved from the once-a-year, 80-question survey to continuous, pulse-based listening — often combined with passive signals (collaboration data, tool usage, sentiment analysis of open-text comments).
McKinsey’s 2025 HR Monitor offers a useful reality check here: nearly 20% of surveyed employees report dissatisfaction with their employer, yet only 7% say they have concrete plans to leave. That gap is exactly the “quiet quitting” risk zone — people who are disengaged but not yet job-searching, which is both an opportunity (they’re reachable) and a warning (disengagement compounds quietly before it shows up in turnover numbers).
The same research found that employees rank job security as their top reason for staying (39%), followed by work-life balance (34%) and relationships with colleagues (33%) — yet many HR functions still over-index on compensation and scheduling levers, under-addressing what actually drives retention.
Engagement Analytics Framework: Listen → Diagnose → Act → Close the Loop
- Listen continuously, not just annually — pulse surveys, always-on feedback channels, and (where ethically and legally appropriate) passive signals like meeting load or collaboration patterns.
- Diagnose at the right altitude. Company-wide engagement scores are almost useless for action; segment by team, manager, tenure band, and location to find where the real story is.
- Act on the drivers, not just the score. A low engagement number is a symptom. Manager quality, workload, growth opportunity, and psychological safety are usually the underlying drivers.
- Close the loop visibly. One of the most consistent findings in engagement research, across nearly every major survey provider, is that failing to communicate what changed as a result of a survey does more damage to trust than not surveying at all.
Common Mistakes
- Surveying too often without acting, which trains employees to stop responding honestly (or at all).
- Treating engagement as an HR-owned metric rather than a manager-owned outcome that HR enables.
- Ignoring open-text comments because they’re harder to quantify — this is exactly where generative AI-assisted sentiment analysis now adds real value, by surfacing themes at scale that used to require manual coding.
Learning and Development (L&D) Analytics
L&D has historically been one of the hardest HR functions to measure — “completion rate” tells you almost nothing about whether learning changed behavior or business outcomes. McKinsey’s 2025 research paints a candid picture of the gap: employee development remains highly fragmented across many organizations, 26% of employees report receiving no feedback in the past year, some employees spend as few as six days on training annually, and only about a third of critical skills gaps are being addressed with any real intentionality.
A Better L&D Measurement Model
| Level | Question | Example Metric |
|---|---|---|
| Reaction | Did learners find it valuable? | Post-training satisfaction score |
| Learning | Did they actually acquire the skill? | Assessment/skill-check scores |
| Behavior | Are they applying it on the job? | Manager-observed behavior change, 90-day follow-up |
| Results | Did it move a business metric? | Productivity, quality, retention, promotion rate of participants |
Most organizations measure heavily at “Reaction” and barely at “Results” — precisely backwards from where the real value lives.
AI’s Growing Role in L&D
SHRM’s 2025 research found that among organizations using AI to support learning, the most common applications are recommending or generating personalized learning content (47%) and tracking learner progress (38%). Organizations doing this report the approach has made programs more effective, reduced costs, and increased engagement in learning activities. There’s also a strong link, per SHRM’s related research, between how well an organization integrates AI thoughtfully into work (versus bolting it on) and how satisfied employees are with training — 97% satisfaction among workers who rate their organization’s AI integration as excellent, versus roughly a fifth of that among those who rate it poorly. In other words: the technology matters less than the change management around it.
Practical Recommendation
Tie every major L&D investment to at least one Level 3 (Behavior) or Level 4 (Results) metric before you build it — not after. If you can’t articulate what changes on the job because someone completed the program, reconsider whether the program is the right intervention.
Performance Management Analytics
Performance management has quietly become one of the most contested spaces in HR — not because measurement is impossible, but because traditional annual-review models have lost credibility with both employees and managers.
Deloitte’s 2025 research is notably blunt on this point: reinventing performance management processes alone won’t unlock human performance. The deeper issue is that performance data has often been collected primarily for compliance and compensation decisions, not to actually help people improve.
What Good Performance Analytics Looks Like
- Calibration analysis: identifying rating inflation or inconsistency across managers, teams, or demographic groups — a critical fairness check.
- Goal-cascade tracking: whether individual and team goals actually connect to business objectives, not just exist in a system.
- Feedback frequency and quality analysis: how often meaningful feedback (not just a rating) is actually happening.
- Performance-potential correlation: understanding where current performance and future potential diverge (a foundation for succession planning, covered next).
A Word of Caution
Performance ratings are among the most bias-susceptible data points in the entire HR data ecosystem — recency bias, halo effects, and manager-to-manager inconsistency are well documented in organizational psychology research going back decades. Any analytics built on top of performance ratings (including AI models used for promotion or succession recommendations) inherits those biases unless the underlying rating process itself is calibrated and audited. This is a point worth repeating throughout this article: analytics amplifies whatever is already in your data, good or bad.
Succession Planning
Succession planning used to be a binder — literally, in many organizations, a physical or PDF document reviewed once a year by the executive team, often based on subjective “high potential” nominations with little supporting evidence.
Analytics changes this in three ways:
- Bench strength visibility: dashboards showing, for every critical role, how many ready-now and ready-in-1–2-years successors exist — instantly flagging single points of failure.
- Objective potential indicators: combining performance history, mobility/readiness signals, skill assessments, and (carefully governed) manager input rather than a single subjective nomination.
- Bias auditing of the “high potential” pool: checking whether HiPo designations skew disproportionately toward certain demographics, tenure patterns, or proximity to senior leaders — a well-documented risk in succession processes that rely heavily on visibility and sponsorship rather than demonstrated capability.
A Simple Succession Health Checklist
- [ ] Every business-critical role has at least one identified successor, ideally two.
- [ ] “Ready now” claims are backed by evidence (stretch assignments, cross-functional exposure), not just a manager’s confidence.
- [ ] The successor pool’s demographic composition is reviewed for unintentional narrowing.
- [ ] Succession plans are refreshed at least annually and tied to actual development plans, not just a name in a box.
Diversity, Equity, and Inclusion (DEI) Metrics
DEI analytics has become both more important and more politically contested in the last few years — a tension HR leaders can’t wish away. Whatever the external climate, the measurement discipline itself remains sound business practice: understanding where representation, opportunity, and outcomes diverge across groups is a legitimate risk and performance question, separate from any particular policy stance.
Core DEI Metrics Worth Tracking
| Category | Example Metrics |
|---|---|
| Representation | Workforce composition by level, function, and demographic group over time |
| Opportunity | Promotion rates, stretch-assignment access, and high-potential nomination rates by group |
| Pay equity | Statistically controlled pay-gap analysis (adjusted for role, level, tenure, location, performance) |
| Inclusion (experience) | Belonging and psychological-safety survey items, analyzed by segment |
| Attrition equity | Whether voluntary turnover rates differ meaningfully by group, and why |
A Practical Note on Pay Equity Analysis
A raw, unadjusted pay gap (e.g., comparing average pay of two groups without controlling for role, level, tenure, and location) is a starting flag, not a conclusion. Credible pay equity analysis uses regression-based adjustment to isolate whether a gap persists after accounting for legitimate, job-related factors. Getting this technically right matters enormously — both because a poorly controlled analysis can produce false alarms (or false comfort), and because in many jurisdictions, pay equity reporting now carries real legal exposure.
Where DEI Analytics Adds the Most Value
The highest-value DEI analytics work usually isn’t the annual representation report (useful for accountability, but backward-looking). It’s diagnosing where in the talent lifecycle representation narrows — sourcing, interview-to-offer conversion, promotion velocity, or attrition — because that tells you exactly where to intervene, rather than treating “diversity” as one undifferentiated problem.
Compensation Analytics
Compensation is one of the oldest quantitative disciplines in HR, but it’s becoming far more sophisticated as organizations connect pay data to retention, performance, and equity analysis in real time rather than during an annual cycle.
Key Compensation Analytics Use Cases
- Market competitiveness benchmarking: comparing internal pay bands to external market data by role, level, and geography, refreshed more frequently than the traditional annual survey cycle.
- Pay compression analysis: identifying where long-tenured employees are being out-earned by new hires — a well-known, quietly corrosive driver of attrition among your most experienced people.
- Pay-for-performance alignment: checking whether merit increases and bonuses actually correlate with performance ratings, or whether the relationship has drifted (a common finding when compensation processes run on autopilot).
- Total rewards ROI: understanding which benefits and reward elements actually influence retention and engagement versus which are simply cost centers with low perceived value.
A Compensation Analytics Checklist
- [ ] Pay bands are benchmarked against current market data, not data that’s 18+ months old.
- [ ] Pay equity analysis is conducted proactively (and remediated), not only in response to a complaint or audit.
- [ ] Compression is monitored specifically for critical-skill and high-tenure populations.
- [ ] Total rewards spend is periodically evaluated against actual employee-reported value, not just cost.
Attrition Prediction and Retention Strategy
This is often the flagship use case people mean when they say “predictive people analytics” — and it deserves careful treatment, both for its promise and its pitfalls.
How Attrition Models Actually Work
At a technical level, most attrition prediction models are relatively standard machine learning classification problems: historical data (tenure, compensation relative to market, manager changes, engagement scores, promotion velocity, performance trends, commute distance, and dozens of other variables) is used to train a model that estimates the probability an individual employee will leave voluntarily within a defined window — often 90 or 180 days.
Industry benchmarking suggests that roughly a third of organizations with mature HR analytics functions are already using some form of AI-driven turnover prediction, and the number is rising quickly as the underlying tools become more accessible.
Why this Is Harder Than It Looks?
Recent academic and industry research on attrition modeling raises three consistent concerns:
- Bias inheritance. Models trained on historical data inherit the biases in that data. If certain groups have historically been rated lower due to biased evaluation (not actual performance), a model trained on that history will replicate the pattern, potentially flagging employees from those groups as “flight risks” for the wrong reasons — for example, misreading quieter communication styles or remote-work patterns as disengagement.
- Self-fulfilling prophecy risk. If managers treat a flagged employee differently — subtly excluding them from opportunities because “they’re probably leaving anyway” — the model can actively cause the outcome it predicted.
- The trust problem. Employees are, understandably, uneasy about being scored by an algorithm they can’t see or question. Researchers studying the ethics of predictive attrition tools have argued that the next generation of HR technology will be defined less by prediction accuracy and more by how transparently and responsibly organizations use what they learn.
Responsible Attrition Analytics: A Practical Framework
- Use flags to trigger a human conversation, never an automated action. A model output should open a coaching conversation between a manager and HRBP — not trigger an intervention (or worse, a quiet demotion in opportunity) without human review.
- Prioritize explainability over marginal accuracy. A model that’s 2% less accurate but tells a manager why someone is flagged (compensation gap, no promotion in 3 years, manager change) is far more useful and far more defensible than a black-box score.
- Audit for demographic disparity in flags, the same way you’d audit a hiring algorithm.
- Pair prediction with a retention playbook. A risk score without a corresponding action plan (stay interviews, targeted development, compensation review) is just an expensive way to confirm what HR often already suspected.
Retention Strategies That the Data Consistently Supports
Across McKinsey, SHRM, and Deloitte’s research, a few retention levers show up again and again as more powerful than compensation alone:
- Manager quality — arguably the single strongest predictor of team-level retention across nearly every major workforce study of the last two decades.
- Career growth and internal mobility — employees who can see a path forward are dramatically less likely to look outside.
- Psychological safety and belonging — teams where people feel safe to speak up show consistently lower voluntary turnover.
- Recognition and meaningful work — not just praise, but a clear line of sight to why the work matters.
Key takeaway: Attrition prediction is a genuinely valuable tool, but it’s most powerful when it’s treated as an early-warning system for a human conversation — not a verdict.
Productivity Measurement
Productivity measurement in HR has always been tricky, because “productivity” means something different for a call center agent, a software engineer, and a research scientist. The rise of hybrid work and now AI-assisted work has made it both more urgent and more complicated.
The Trap: Measuring Activity Instead of Output
A common mistake — and one HR should actively push back on when it comes from other functions — is equating “productivity” with surveillance metrics like keystrokes, active screen time, or hours logged. These measure activity, not value created, and research consistently shows they damage trust without reliably predicting actual output.
A Better Productivity Framework
- Output-based metrics where possible (units produced, deals closed, tickets resolved, code shipped, projects delivered) rather than input-based (hours worked).
- Capacity and workload analysis — understanding whether teams are appropriately staffed for the work in front of them, which is often a better lever than “motivating” people to be more productive.
- AI-adjusted productivity tracking — Microsoft’s 2026 Work Trend Index found that AI “frontier professionals” (the most advanced adopters) are producing work previously impossible at a rate far above average users, but the research also cautions that raw productivity gains, without organizational redesign, don’t automatically translate into better business results. Measuring AI-assisted productivity honestly means looking beyond “time saved” to whether the freed-up capacity is being redirected toward higher-value work.
A Note of Caution from the Research
It’s worth flagging that independent scrutiny of large AI productivity studies (including academic research published in outlets like the Quarterly Journal of Economics) has found that AI gains are uneven — often largest for less experienced workers and smallest for top performers, and that overconfidence in AI outputs on unfamiliar tasks can actually reduce quality. Productivity dashboards that don’t account for this nuance risk giving leadership a falsely simple picture.
Workforce Forecasting
Workforce forecasting extends workforce planning into a more quantitative, scenario-driven discipline — projecting future headcount, skills mix, and cost under different business and macroeconomic conditions.
What Good Forecasting Includes
- Demand forecasting: projected headcount and skills needs based on revenue/growth plans, automation roadmaps, and strategic initiatives.
- Supply forecasting: projected attrition, retirement eligibility, internal mobility, and time-to-productivity for new hires.
- Scenario modeling: base case, growth case, and contraction case, ideally refreshed quarterly rather than annually — this is where workforce forecasting has changed most in recent years, moving away from a single static annual number toward a living model.
- Cost modeling: fully loaded workforce cost projections tied to the above, so finance and HR are working from the same numbers rather than reconciling two competing forecasts after the fact.
Given how much macroeconomic and technological volatility organizations are navigating right now — labor market softening in some sectors alongside acute skills shortages in others — static, once-a-year forecasts are increasingly seen as a liability rather than a planning tool.
Organizational Network Analysis (ONA)
Organizational network analysis is one of the most underused but potentially high-value branches of people analytics. It maps the informal patterns of collaboration, communication, and influence inside an organization — the actual way work gets done, which is often very different from the formal org chart.
What ONA Can Reveal
- Hidden influencers: employees who aren’t in formal leadership roles but who significant numbers of colleagues route around, rely on, or seek out for advice — often your real succession risk if they leave.
- Collaboration bottlenecks: teams or individuals who are single points of failure because too much cross-team work flows through them, risking burnout and business continuity.
- Silos: groups that should be collaborating (based on strategy) but show almost no informal connection in the data — a common finding after mergers or reorganizations.
- Onboarding and inclusion signals: new hires or underrepresented employees who show unusually sparse network connections, which often predicts disengagement or attrition well before it shows up in a survey.
A Practical Caution
ONA is typically built from meeting patterns, email metadata, or collaboration-tool data — which means it sits squarely in the privacy-sensitive category discussed in Part 18. The most responsible implementations use aggregated, anonymized network patterns for organizational diagnosis (e.g., “this team is a bottleneck”) rather than individually surfacing who talks to whom, and are transparent with employees about what’s being analyzed and why.
The Role of AI in HR Decision-Making and People Analytics
AI now touches nearly every HR discipline described above, but it’s worth stepping back and being precise about what AI is actually good at in HR — and where human judgment remains essential.
Where AI Adds Genuine Value
- Pattern detection at scale: finding correlations and trends across thousands of data points that a human analyst would take weeks to surface manually.
- Natural-language synthesis: summarizing open-ended survey comments, performance narratives, or exit interview transcripts into digestible themes.
- Automation of repetitive analytical tasks: building routine reports, flagging anomalies, drafting first-pass analyses that a human then refines.
- Scenario modeling: running “what if” workforce simulations far faster than manual spreadsheet modeling allows.
Where Human Judgment Still Has to Lead
- Final decisions about people’s careers — hiring, promotion, termination, and compensation decisions should never be fully automated, both for ethical reasons and, increasingly, for legal ones (more in Part 19).
- Interpreting context AI can’t see — a spike in a team’s attrition risk might be explained by a manager’s upcoming retirement announcement that hasn’t yet been entered into any system.
- Values-based tradeoffs — deciding what an organization should do with a data insight is a judgment call informed by culture and ethics, not something a model can determine.
SHRM’s 2026 State of AI in HR research, based on a survey of over 1,700 HR professionals, found a telling gap: 92% of CHROs expect AI to become more deeply integrated into HR this year, but more than half of organizations report no AI deployed in their HR function at all yet, and the most mature use cases remain concentrated in recruiting. The report’s recommendation is a good rule of thumb for any HR team starting out: begin with high-volume, low-risk tasks (drafting job descriptions, summarizing feedback, generating onboarding materials) and be deliberately cautious about using AI for final hiring or performance decisions until governance is mature.
A Simple Decision Rule
Before deploying AI to any HR use case, ask: if this model is wrong about a specific employee, what happens to them? The higher the stakes of that answer, the more human oversight and explainability the use case requires.
How HR Professionals Interpret Data Without Becoming Data Scientists
This is, honestly, the question most HR professionals actually want answered — not “how do I build a machine learning model,” but “how do I get comfortable enough with data to do my job well in this new environment.”
The good news: you don’t need to become a data scientist. You need to become data literate, which is a very different and far more achievable bar.
The Core Skills That Matter Most
- Asking better questions before looking at data. The single biggest skill gap in HR analytics isn’t technical — it’s the discipline of defining precisely what business question you’re trying to answer before you open a dashboard. “Why is turnover high?” is too vague. “Why is voluntary turnover among 1–3 year tenure employees in our technical roles 40% higher than the company average?” is answerable.
- Understanding correlation versus causation. If engagement scores and retention move together, that doesn’t automatically mean improving engagement scores will improve retention — a third factor (like manager quality) might be driving both. HR professionals don’t need to run causal inference models themselves, but they do need to ask the question and push back on lazy conclusions.
- Reading a chart critically. Is the axis truncated to exaggerate a trend? Is the sample size large enough to trust? Is a percentage change meaningful in absolute terms (a jump from 2% to 4% attrition in a tiny team can look dramatic and mean almost nothing statistically)?
- Basic statistical vocabulary. You don’t need to calculate a p-value by hand, but understanding what “statistically significant,” “sample size,” “median versus average,” and “correlation” mean lets you have an intelligent conversation with an analyst or a vendor.
- Knowing when to bring in a specialist. Data literacy also means recognizing the edge of your own competence — knowing when a pay equity analysis or predictive model needs a qualified analyst or statistician rather than a self-service dashboard.
A Practical Learning Path for HR Generalists
| Stage | Focus | Example Activities |
|---|---|---|
| Foundational | Comfort with numbers and basic HR metrics | Learn to build and interpret core HR KPI reports (turnover, time-to-fill, engagement) confidently |
| Applied | Interpreting dashboards and asking sharper questions | Practice translating a business question into a data request; learn to read visualizations critically |
| Intermediate | Light hands-on analysis | Get comfortable in Excel/Power BI with pivot tables, basic trend analysis, and simple correlations |
| Advanced | Partnering on predictive work | Understand model logic well enough to validate outputs and challenge assumptions, even without building the model yourself |
You’ll notice this path never requires learning to code a neural network from scratch. That’s intentional — most HR professionals will be consumers and interpreters of analytics, working alongside dedicated people analytics specialists or data teams, not building the models themselves. The differentiator is being a sharp, skeptical, business-savvy interpreter of what the data is (and isn’t) telling you.
How Analytics Supports Better Business Decisions
The through-line across every section of this article is this: analytics doesn’t replace HR judgment, it sharpens it by grounding decisions in evidence rather than anecdote, surfacing patterns invisible to any single manager, and creating a shared, defensible language between HR and the rest of the business. A CFO doesn’t need to trust HR’s intuition about a retention risk — they can look at the same underlying data HR is using and understand the logic. That shared evidentiary language is, in many ways, the real prize of the analytics shift — not the dashboards themselves, but the credibility and influence they buy HR at the decision-making table.
People Analytics – Implementation Challenges, Ethics & Privacy
This is the part of the people analytics conversation that gets the least airtime in vendor pitches — and the most important for HR professionals to own with real seriousness.
Common Implementation Challenges
- Data fragmentation. Even organizations with modern HCM systems often have performance data in one tool, engagement data in another, and learning data in a third, with no reliable way to join them.
- Data quality. Incomplete records, inconsistent job title taxonomies, and manually entered fields riddled with errors quietly undermine even sophisticated models.
- Change management, not technology. Multiple industry surveys point to the same finding, in different words: the biggest barrier to analytics maturity isn’t the tooling, it’s manager and leadership trust and adoption. A brilliant dashboard nobody uses to make a decision has zero value.
- Skills gaps within HR itself. SHRM’s research on AI adoption identifies a widening skills gap as a central risk of the current moment — organizations are deploying tools faster than they’re building the internal capability to use them responsibly.
- Fragmented ownership. Is people analytics owned by HR, IT, or a centralized data/analytics function? Ambiguous ownership slows everything down and often leads to duplicated, inconsistent reporting.
Ethical Considerations and Employee Privacy
People analytics deals with some of the most sensitive data an organization holds — performance history, compensation, health-related accommodations, and increasingly, behavioral and communication patterns. A few principles worth treating as non-negotiable:
- Transparency. Employees should know, in plain language, what workforce data is collected and broadly how it’s used — not buried in a dense policy document nobody reads.
- Purpose limitation. Data collected for one purpose (say, collaboration tool usage for IT security) shouldn’t quietly be repurposed for performance evaluation without disclosure.
- Minimum necessary data. Just because a data point is available doesn’t mean it should be collected or used — restraint is itself an ethical stance, not just a legal one.
- Human review of consequential decisions. As discussed in Part 13 and 17, no model output should directly determine a hiring, promotion, compensation, or termination decision without a human reviewing the full context.
- Right to explanation. Employees affected by an algorithmic decision should be able to get a meaningful explanation of the factors involved — not just “the algorithm flagged you.”
Academic research on the ethics of people analytics consistently frames the core tension as one between organizational value creation and individual privacy and autonomy — and argues that trust, once damaged by opaque or intrusive data practices, is very difficult to rebuild. As one researcher’s framing puts it, the industry is at something of a turning point: the technical capability to monitor and predict employee behavior has outpaced the governance frameworks to use that capability responsibly.
Algorithmic Bias: A Closer Look
Bias in HR algorithms typically enters through one of three doors:
- Historical bias in training data — if past hiring or promotion decisions were biased, a model trained on that history learns to replicate the pattern, even without any demographic field in the dataset, because other variables (school attended, zip code, communication style, even resume gaps) can act as proxies.
- Measurement bias — using a flawed proxy for a real concept (e.g., using “hours logged” as a proxy for “productivity” systematically disadvantages employees with caregiving responsibilities or disabilities).
- Deployment bias — even a well-built, fair model can produce biased outcomes if it’s applied inconsistently, or if managers selectively act on its recommendations only for certain employees.
A Responsible AI Checklist for HR Analytics
- [ ] Has the model (or vendor tool) been independently tested for disparate impact across protected groups?
- [ ] Can the model’s output be explained in plain language to an affected employee?
- [ ] Is there a documented human-review step before any consequential decision is finalized?
- [ ] Is the underlying training data representative, current, and free of known historical bias where reasonably identifiable?
- [ ] Is there a periodic re-audit process, since models and workforce composition both drift over time?
- [ ] Have legal and privacy teams reviewed the use case against applicable regulation?
Legal Considerations
Regulation of AI in employment decisions is moving quickly and varies significantly by jurisdiction — from local laws governing automated employment decision tools, to broader data protection regimes that give employees rights over how their data is processed, to emerging AI-specific legislation addressing high-risk uses like hiring and performance evaluation. This is a genuinely fast-moving area, and the practical recommendation for HR leaders is straightforward even if the details aren’t: treat legal and privacy counsel as a standing partner in any people analytics initiative from the design stage, not a compliance checkpoint bolted on at the end.
People Analytics – An Implementation Roadmap
If you’re building or maturing a people analytics capability, here’s a phased approach that reflects how successful implementations tend to actually unfold, based on the maturity patterns described earlier in this article.
Phase 1: Foundation (Months 1–6)
- Audit and clean core HR data sources; establish a single source of truth for core metrics.
- Define your top 5–8 KPIs across the employee lifecycle and get organizational agreement on definitions (a shocking amount of analytics failure traces back to two departments defining “turnover” differently).
- Build basic descriptive dashboards for the metrics that matter most to your current business priorities.
- Establish a data governance and privacy framework before, not after, expanding scope.
Phase 2: Diagnostic Capability (Months 6–12)
- Move beyond “what happened” to “why” — segment key metrics by team, tenure, manager, and demographic group (with appropriate privacy safeguards).
- Build the habit of pairing every dashboard with a recommended action, not just a number.
- Train HRBPs and people managers on how to read and act on the dashboards you’ve built — adoption is the real bottleneck at this stage, not additional features.
Phase 3: Predictive Capability (Year 2+)
- Pilot predictive use cases in a single, well-scoped, lower-risk area (e.g., time-to-fill forecasting) before tackling higher-stakes areas like attrition prediction.
- Build (or buy, with rigorous vendor due diligence) explainable models, with bias auditing built into the process from day one.
- Establish a clear governance body — often a cross-functional group spanning HR, legal, IT, and data/analytics — to review and approve predictive use cases before deployment.
Phase 4: Prescriptive and Embedded Analytics (Ongoing)
- Embed recommended actions directly into manager workflows (e.g., a retention risk flag that comes with a suggested conversation guide, not just a score).
- Continuously re-audit models for drift and bias as the workforce and business context change.
- Treat people analytics as a permanent capability with dedicated ownership, not a project with an end date.
Future Trends in People Analytics
A few directions worth watching, grounded in where the research and market data are already pointing:
- Agentic AI moving from pilot to production. Multiple 2026 industry analyses point to agentic AI — systems that execute multi-step workflows autonomously — as the next major shift in HR technology, with significant projected growth in adoption over the next few years, though with human oversight remaining critical.
- Skills-based everything. Workforce planning, hiring, internal mobility, and even pay are increasingly organized around verified skills rather than job titles or degrees, a trend accelerating as AI reshapes what specific roles actually require.
- Convergence of employee experience, talent intelligence, and people analytics into unified platforms. Market research shows these three segments are the fastest-growing parts of the HR technology market, and vendors are increasingly bundling them rather than selling them as separate point solutions.
- Rising regulatory scrutiny of algorithmic HR decisions. Expect continued expansion of laws and standards specifically addressing AI use in hiring, performance evaluation, and pay decisions.
- A maturing conversation about AI’s productivity ceiling. As the initial hype around AI-driven productivity gains meets more rigorous, skeptical research, expect organizations to get more disciplined about measuring actual business impact rather than adoption metrics alone.
- People analytics as a distinct career track, not a rotational assignment — a trend covered in more depth below.
Career Opportunities in People Analytics
For HR professionals thinking about where this shift leaves their own career, the honest answer is: it opens doors rather than closes them, but it does reward a specific kind of adaptability.
Roles that have emerged or expanded significantly in recent years include:
- People Analytics Manager/Director — owns the analytics function’s roadmap, tooling, and stakeholder relationships.
- HR Data Analyst — builds and maintains dashboards, conducts diagnostic analysis, partners with HRBPs on specific business questions.
- Workforce Planning Specialist — focuses specifically on forecasting, scenario modeling, and skills supply/demand analysis.
- Talent Intelligence Analyst — increasingly common in recruiting, focused on market data, competitor benchmarking, and skills-based talent mapping.
- People Analytics Consultant — internal or external advisory roles helping organizations build analytics maturity.
- Responsible AI/HR Technology Ethics Lead — an emerging role in larger organizations specifically tasked with governance of AI used in HR decisions.
You don’t need to abandon a generalist HR career to benefit from this shift, either. HRBPs, talent acquisition partners, and L&D professionals who develop genuine data fluency — even without pivoting into a dedicated analytics role — consistently report more influence in strategic conversations, because they can bring evidence to the table instead of just opinion.
Conclusion: Embracing the Analytical Turn
The rise of people analytics isn’t really a story about technology. It’s a story about HR earning — and being asked to prove — the strategic credibility the function has wanted for decades. The tools have finally caught up to the ambition. Cloud HR systems gave HR clean data. AI and predictive analytics gave HR the ability to find patterns and forecast outcomes at a speed no team of analysts could match by hand. And a more demanding business environment gave HR every reason to use both.
None of this means HR is becoming a numbers-only discipline, and it shouldn’t. The organizations getting this right — the ones showing up in Deloitte’s, McKinsey’s, and Gartner’s research as genuine leaders — are the ones treating data as a way to sharpen human judgment, not replace it. A retention risk score is a prompt for a manager conversation, not a verdict. An engagement dashboard is a starting point for understanding a team, not the whole story. The best people analytics work still requires everything HR has always been good at: reading a room, understanding context, and caring, genuinely, about the people behind the data points.
Practical next steps if you’re an HR professional reading this:
- Get fluent in your organization’s core HR metrics — know your numbers cold, and know what’s driving them.
- Ask sharper questions of any dashboard or report you’re handed; don’t just accept the headline number.
- Build a working relationship with whoever owns data/analytics in your organization, even informally.
- Push, respectfully but consistently, for ethical guardrails whenever AI touches a consequential people decision.
- Pick one metric you own and take it from descriptive (“here’s what happened”) to diagnostic (“here’s why”) this quarter.
The shift toward data-driven HR is not slowing down, and it doesn’t require you to become someone you’re not. It asks you to become a sharper, more evidence-grounded version of the HR professional you already are. That’s a genuinely achievable, and genuinely valuable, place to grow toward — and the organizations (and careers) that get there first will have a real advantage in the years ahead.
People Analytics Frequently Asked Questions
1. What is the difference between HR analytics and people analytics? The terms are often used interchangeably. Where a distinction is drawn, “HR analytics” sometimes refers more narrowly to analyzing HR function performance (recruiting efficiency, HR service delivery), while “people analytics” refers more broadly to using workforce data to inform business and talent decisions across the organization.
2. Do I need to know how to code to work in people analytics? Not necessarily, especially for HR generalists who need to interpret and act on data rather than build models. Dedicated people analytics roles increasingly benefit from skills in SQL, Excel/Power BI, and sometimes Python or R, but most HR professionals succeed with strong data literacy rather than coding ability.
3. What’s the single most important metric to start tracking? There isn’t one universal answer, but voluntary turnover (segmented by tenure, team, and performance) is a strong starting point for most organizations because it’s directly tied to cost and is usually already available in your HRIS.
4. How accurate are attrition prediction models, really? Accuracy varies significantly by data quality, model design, and organization. More important than raw accuracy is explainability and how responsibly the output is used — a moderately accurate, explainable model paired with good manager conversations often outperforms a highly accurate black-box model nobody trusts.
5. Is people analytics only relevant for large enterprises? No. Smaller organizations increasingly get meaningful analytics capability bundled directly into affordable HRIS and payroll platforms, without needing a dedicated analytics team.
6. What’s the biggest mistake organizations make when starting a people analytics program? Starting with technology (buying a platform) before defining the business questions the organization actually needs answered. Tools without clear questions produce dashboards nobody uses.
7. How does AI change the role of the HR business partner? AI increasingly automates routine analysis and reporting, freeing HRBPs to focus on interpretation, coaching managers, and translating data into action — arguably making the human, relationship-driven side of the HRBP role more important, not less.
8. Can predictive analytics eliminate turnover? No, and it shouldn’t be sold that way. Predictive analytics can identify elevated-risk situations earlier and support better-informed retention conversations, but turnover has real, often legitimate drivers (career growth elsewhere, life changes, compensation) that no model eliminates.
9. How do organizations avoid bias in HR algorithms? Through independent bias testing before deployment, ongoing auditing after deployment, using explainable models, keeping humans in the loop for consequential decisions, and being deliberate about what data is used and why.
10. What data privacy protections should employees expect? Transparency about what’s collected and why, purpose limitation (data isn’t quietly repurposed), minimal necessary collection, and a meaningful human review process for any decision that significantly affects them.
11. Is employee monitoring the same thing as people analytics? No, and conflating the two damages trust in legitimate analytics work. People analytics, done well, focuses on aggregate patterns and evidence-based decision-making — not surveillance of individual behavior for its own sake.
12. How long does it take to build a mature people analytics function? Based on typical implementation patterns, expect roughly 6–12 months to establish solid descriptive and diagnostic capability, and a year or more beyond that to responsibly build predictive capability — assuming consistent investment and leadership support.
13. What’s the ROI of investing in people analytics? Industry benchmarking suggests organizations with mature analytics functions report meaningfully faster decision-making and stronger competitive performance, though ROI is best measured against your organization’s specific, quantified use cases (e.g., reduced attrition cost, improved hiring success rate) rather than a generic industry number.
14. Should HR own people analytics, or should it sit with IT/data teams? Most mature organizations use a hybrid model: a dedicated people analytics function (often within HR, sometimes matrixed with a central data/analytics team) that combines HR domain expertise with technical analytics skill.
15. How is generative AI different from earlier HR analytics tools? Generative AI can synthesize unstructured data (open-text survey comments, performance narratives, exit interview transcripts) and communicate findings in natural language, which earlier analytics tools — largely built for structured, numerical data — couldn’t do nearly as well.
16. What skills should an HR professional build first to get comfortable with analytics? Start with fluency in your organization’s core metrics, comfort reading and questioning a dashboard critically, and basic statistical vocabulary (correlation, sample size, significance) — technical modeling skills are a later-stage investment, not a starting point.
17. Are there legal risks to using AI in hiring or performance decisions? Yes, and the regulatory landscape is evolving quickly across jurisdictions. Any organization using AI in consequential employment decisions should involve legal and privacy counsel from the design stage, not as an afterthought.
18. How do I make the business case for investing in people analytics? Tie the investment to a specific, quantified business problem (cost of attrition, cost of slow hiring, pay equity risk) rather than a general appeal to “better insight” — specificity is what secures budget.
19. What’s organizational network analysis, and is it worth investing in? It’s the mapping of informal collaboration and influence patterns across an organization, useful for identifying hidden key players, bottlenecks, and silos. It’s valuable but privacy-sensitive, and works best when built on aggregated, anonymized patterns rather than individual-level surveillance.
20. Will AI eventually replace HR jobs? The more consistent finding across current research is that AI is reshaping HR work — automating routine tasks and analysis — rather than eliminating the function outright. The roles most at risk are narrowly transactional ones; roles built around judgment, relationships, and strategic interpretation of data are, if anything, becoming more valuable.
Glossary of Key People Analytics Terms
- People Analytics: The practice of using workforce data and analytical methods to inform HR and business decisions.
- Descriptive Analytics: Analysis that explains what has happened (e.g., historical turnover rate).
- Diagnostic Analytics: Analysis that explains why something happened (e.g., root causes of turnover).
- Predictive Analytics: Analysis that forecasts what is likely to happen (e.g., attrition risk scoring).
- Prescriptive Analytics: Analysis that recommends specific actions based on predicted outcomes.
- HRIS (Human Resources Information System): The core system of record for employee data.
- HCM (Human Capital Management): A broader category of integrated cloud platforms managing the full employee lifecycle.
- ATS (Applicant Tracking System): Software used to manage recruiting and hiring workflows.
- Quality of Hire: A measure of how well a new hire performs and retains, typically assessed 6–12 months post-hire.
- Time-to-Fill / Time-to-Hire: Metrics measuring the speed of the recruiting process.
- Attrition/Turnover Prediction: Machine learning models estimating the likelihood an employee will leave.
- Explainable AI (XAI): AI models designed so their outputs and reasoning can be understood by humans, not just used as a black box.
- Algorithmic Bias: Systematic, unfair skew in an algorithm’s outputs, often inherited from biased training data.
- Organizational Network Analysis (ONA): The mapping of informal collaboration and communication patterns within an organization.
- Pay Equity Analysis: A statistically controlled analysis of whether pay differs across demographic groups after accounting for legitimate job-related factors.
- Workforce Planning: The process of forecasting and planning future workforce needs, both in headcount and skills.
- Skills-Based Organization: A workforce model organized around verified skills rather than fixed job titles.
- Agentic AI: AI systems capable of autonomously executing multi-step workflows, beyond single-task automation.
- Sentiment Analysis: The use of AI/NLP to analyze the tone and themes of open-text feedback at scale.
- Data Literacy: The ability to read, interpret, question, and communicate about data effectively without necessarily being a technical data specialist.
- HR Analytics Maturity Model: A framework describing an organization’s progression from basic reporting to advanced predictive/prescriptive capability.
Ready to move your HR function from reporting to real decision-making power? The shift starts with one question, one metric, and one team willing to ask “why” a little more often. That’s how every mature people analytics function got started.