
In 2026, data is everywhere, but decisions still fail when teams do not know how to translate numbers into clear business action. That is why the demand for data analysts remains strong across various industries, including finance, e-commerce, healthcare, consulting, media, and even government. A good data analyst does not only make charts. They help teams understand what is happening, why it is happening, and what should be done next.
If you are starting from zero or switching careers, data analytics is also one of the most practical high-growth paths because it rewards skills and proof of work. You do not need an advanced degree to begin. What you need is a strong foundation in Excel and SQL, a clear understanding of business metrics, and a portfolio that demonstrates your ability to solve real-world problems using data.
In this step-by-step roadmap, you will learn exactly how to become a data analyst in 2026. You will get a clear learning sequence, a realistic weekly plan, the tools you should focus on, portfolio project ideas that employers actually value, and interview preparation guidance. By the end, you will have a structured plan you can follow to become job-ready with confidence.
Target Audience
This blog is meant for you if you want a clear, practical path to become a data analyst in 2026 without confusion or random course-hopping. It is designed to work whether you are a complete beginner or you already have some exposure to Excel or data work. You will find this roadmap useful if you are:
- Students who want an entry-level job in analytics
- Freshers who want a job-ready skill set with a portfolio
- Working professional switching from non-technical roles into analytics
- Someone from commerce, economics, management, or humanities backgrounds who wants a structured learning plan
- Anyone who wants to learn analytics in a way that leads to employability, not only certificates
This roadmap will help you choose the right tools, build the right projects, and develop the ability to explain insights clearly, which is what makes data analysts valuable and well-paid.
What Does a Data Analyst Do?
A data analyst helps a company make better decisions using data. In most real jobs, the work is not about complex algorithms. It is about finding patterns, tracking performance, identifying problems early, and recommending what action to take. You will work with raw data that is often messy, clean it, analyse it, and then present the results in a way that business teams can use. Here are the most common things data analysts do in a typical role:
- Collect and organise data from different sources such as spreadsheets, databases, and tools
- Clean data by fixing missing values, duplicates, wrong formats, and inconsistent entries
- Write SQL queries to pull data and create analysis-ready tables
- Track business performance using KPIs and build regular reports
- Create dashboards in tools like Power BI or Tableau for teams to monitor performance
- Answer ad hoc questions from business teams, such as why sales dropped, which segment is growing, or what is driving churn
- Identify trends and patterns, then explain what they mean for the business
- Present insights and recommendations in a simple way to managers and stakeholders
A strong data analyst is expected to do more than report. They are expected to connect data to business outcomes. For example, instead of only showing that retention is falling, they explain which user segment is leaving, at which stage they drop off, and what change might improve retention.
Data Analyst vs Data Scientist vs Business Analyst
These three roles overlap, which is why people get confused. The easiest way to understand the difference is to look at what each role mainly focuses on and what kind of output they are expected to deliver.
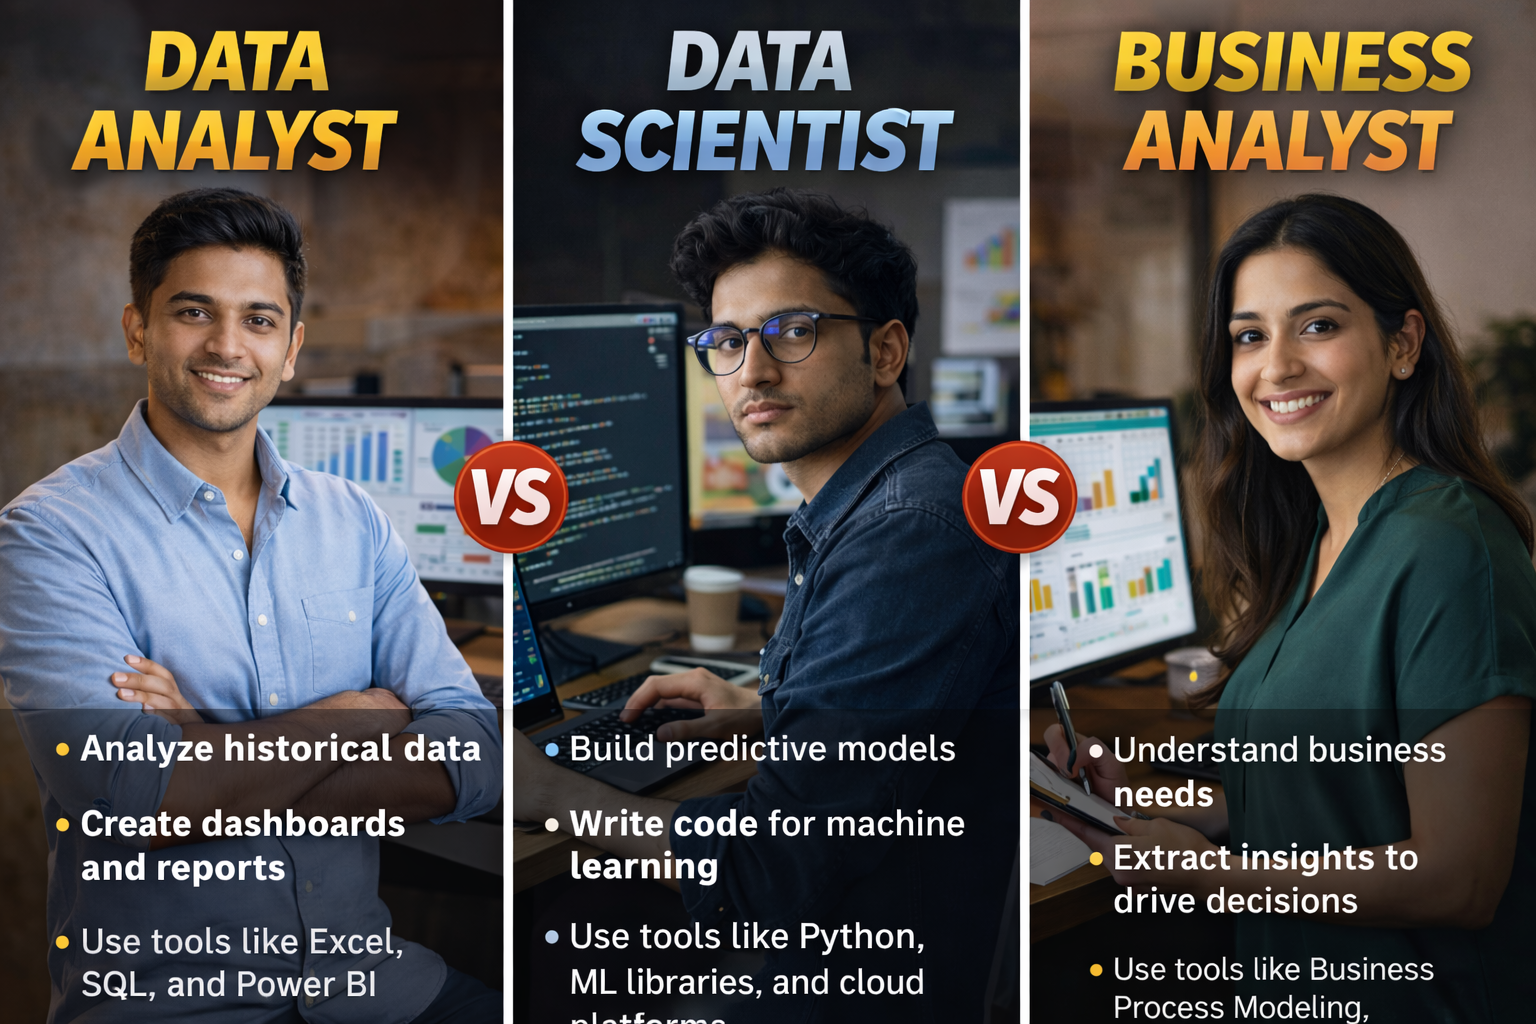
Data Analyst
- A data analyst focuses on understanding what is happening in the business and why it is happening, using data. The work is usually centred on SQL, dashboards, reporting, and actionable insights.
- Common outputs include KPI dashboards, weekly performance reports, funnel and cohort analysis, and recommendations for business teams.
- Typical tools: Excel/Sheets, SQL, Power BI/Tableau, sometimes Python.
Data Scientist
- A data scientist focuses more on building predictive or automated solutions using data. They often create models for churn prediction, demand forecasting, recommendation systems, fraud detection, and similar use cases. The role typically requires stronger statistics and programming skills.
- Common outputs include predictive models, experimentation frameworks, and data-driven product improvements.
- Typical tools: Python/R, SQL, ML libraries, cloud or deployment tools in some roles.
Business Analyst
- A business analyst focuses on solving business problems by gathering requirements, improving processes, defining metrics, and aligning stakeholders. Some business analysts work heavily with data, but many roles focus more on documentation, operations, and process improvement.
- Common outputs include requirement documents, process maps, business cases, and stakeholder alignment.
- Typical tools: Excel, documentation tools, sometimes SQL and BI tools, depending on the company.
Data Analyst vs Data Scientist vs Business Analyst
| Aspect | Data Analyst | Data Scientist | Business Analyst |
|---|---|---|---|
| Primary Focus | Understand and interpret historical data to answer business questions | Build predictive models and advanced analytics to solve complex problems | Bridge business needs and technology using data-driven insights |
| Core Objective | Turn raw data into meaningful reports and dashboards | Extract insights, predict outcomes, and automate decision-making | Improve business processes, strategy, and decision-making |
| Type of Questions Answered | What happened? Why did it happen? | What will happen? What should we do next? | What does the business need? How can we improve it? |
| Nature of Work | Descriptive and diagnostic analysis | Predictive and prescriptive analysis | Strategic and operational analysis |
| Data Complexity | Structured and clean datasets | Structured + unstructured, large-scale data | Aggregated, summarized, and business-focused data |
| Typical Daily Tasks | Data cleaning, querying databases, creating dashboards, reporting KPIs | Data preprocessing, feature engineering, model building, experimentation | Requirement gathering, stakeholder meetings, documentation, analysis |
| Key Skills Required | Data analysis, visualization, statistics, SQL | Machine learning, statistics, programming, data modeling | Business analysis, communication, problem-solving, domain knowledge |
| Technical Skill Level | Medium | High | Low to Medium |
| Programming Languages | SQL, Python (basic), R (optional) | Python, R, SQL, Scala | Usually none; basic SQL or Excel may help |
| Statistical Knowledge | Basic to intermediate | Advanced (probability, inference, optimization) | Basic understanding |
| Machine Learning | Not required | Core responsibility | Not required |
| Data Visualization Tools | Power BI, Tableau, Excel, Looker | Matplotlib, Seaborn, Plotly, Power BI | PowerPoint, Excel, Power BI |
| Big Data Tools | Rarely used | Hadoop, Spark, cloud platforms | Not required |
| Business Interaction | Limited to moderate | Limited | Very high |
| Stakeholder Communication | Explaining insights from reports | Explaining models and predictions | Translating business needs into data or tech solutions |
| Decision-Making Role | Supports decisions with insights | Influences strategic and automated decisions | Drives business and process decisions |
| Output / Deliverables | Dashboards, reports, metrics | Predictive models, algorithms, simulations | Business requirement documents, process maps, insights |
| Domain Knowledge Importance | Helpful | Helpful but not mandatory | Critical |
| Educational Background | Statistics, Math, Economics, IT, Business | Computer Science, Math, AI, Statistics | Business, Management, Economics, IT |
| Career Entry Difficulty | Beginner-friendly | Advanced | Beginner-friendly |
| Typical Experience Level | Entry to mid-level | Mid to senior-level | Entry to senior-level |
| Salary Range (Relative) | Medium | High | Medium |
| Common Job Titles | Data Analyst, BI Analyst, Reporting Analyst | Data Scientist, ML Scientist, AI Specialist | Business Analyst, Product Analyst, Functional Analyst |
| Who Should Choose This Role | People who enjoy working with numbers and visual insights | People who enjoy math, coding, and solving complex problems | People who enjoy strategy, communication, and business improvement |
| Career Progression | Senior Analyst → Analytics Manager | Senior Data Scientist → AI/ML Lead | Senior BA → Product Manager / Strategy Lead |
Which one should you choose in 2026?
- Choose a data analyst if you want the most straightforward entry into analytics and you enjoy working with metrics, reporting, and insights.
- Choose a data scientist if you enjoy math, coding, and building predictive or automated solutions, and you are ready for a steeper learning curve.
- Choose a business analyst if you enjoy stakeholder coordination, problem solving, and process improvement, and you want a role that can lead to product, strategy, or operations paths.
Skills You Need to Become a Data Analyst in 2026
To become job-ready, you do not need to learn everything at once. You need the right sequence. A data analyst is valued for two things: strong basics (Excel and SQL) and the ability to convert data into clear business insight. The skills below are organised into must-have skills and high-value add-on skills.
Must-have Core skills
- Excel or Google Sheets: You should be comfortable with formulas, data cleaning, pivot tables, charts, and building clean summary tables. Excel is still used heavily in real jobs for quick analysis and reporting.
- SQL: SQL is the most important skill for most data analyst roles because most business data lives in databases. You should learn how to filter data, aggregate it, join tables, and create reusable queries. If you have strong SQL, you instantly become more employable.
- Data cleaning and data validation: Real data is messy. You must know how to handle missing values, duplicates, incorrect formats, inconsistent categories, and outliers. You should also learn to validate results so you do not report wrong numbers.
- Basic statistics for analysis: You do not need advanced math for most entry roles, but you do need basics like mean and median, variance, correlation, trend understanding, and how to interpret results without making false claims.
- Data visualisation fundamentals: Your charts should be easy to read, not decorative. You should know how to pick the right chart, label it properly, and avoid misleading visuals.
- Business understanding and KPI thinking: A data analyst should know common metrics like revenue, growth, conversion rate, retention, churn, customer acquisition cost, and customer lifetime value. This is what helps you convert analysis into decisions.
Additional Skills (High-value add-ons)
- Power BI or Tableau: Dashboarding is a major part of many analyst roles. Knowing one dashboard tool well is enough. Power BI is often preferred in many companies because it integrates well with Microsoft ecosystems, while Tableau is common in some product and consulting environments.
- Python (optional but strongly helpful): Python helps you clean data faster, analyse larger datasets, and automate repetitive reports. It is also useful if you want to grow into product analytics or data science later. Focus on pandas and basic visualisation first.
- A/B testing and experimentation basics: Many companies run experiments for marketing or product decisions. Even basic knowledge of how experiments are designed and interpreted can make you stand out.
- Presentation and communication: This is what separates average analysts from strong analysts. You must be able to explain what the numbers mean and what action is recommended in simple language.
Tools to Learn in 2026 (Practical Stack)
You do not need to learn every tool in the market. Most data analyst jobs are won by people who are strong in a small set of tools and can show proof through projects. The goal is to pick one tool per category and get good enough to solve real problems.
- Excel or Google Sheets: This is your fastest tool for analysis and reporting. Learn formulas, pivot tables, charts, and clean reporting layouts.
- SQL (MySQL or PostgreSQL): SQL is essential because company data usually sits in databases. If you can write strong SQL queries, you can answer business questions quickly and reliably.
- Power BI or Tableau: Choose one dashboard tool and learn it well. Focus on dashboard design, filters, drill-downs, and building KPI views that business teams can actually use.
- Python (optional but recommended): Python gives you an edge, especially in product analytics and automation-heavy roles. For data analyst work, you mainly need pandas for analysis and a basic plotting library for charts.
- GitHub or a portfolio page (for proof): Even for analyst roles, showing your projects clearly matters. GitHub is useful for storing SQL queries, dashboards, and project documentation. If you prefer, you can use a simple portfolio page or Notion, but make sure it looks professional.
- Documentation tool (Notion or Google Docs): What makes you stand out is not only doing analysis, but documenting the problem, approach, assumptions, and recommendations. A clean write-up improves credibility.
Step-by-Step Roadmap to Become a Data Analyst in 2026
This roadmap is designed so that you build employable skills in the right order. Each step includes what to learn and what to produce, so you have proof of work by the end.
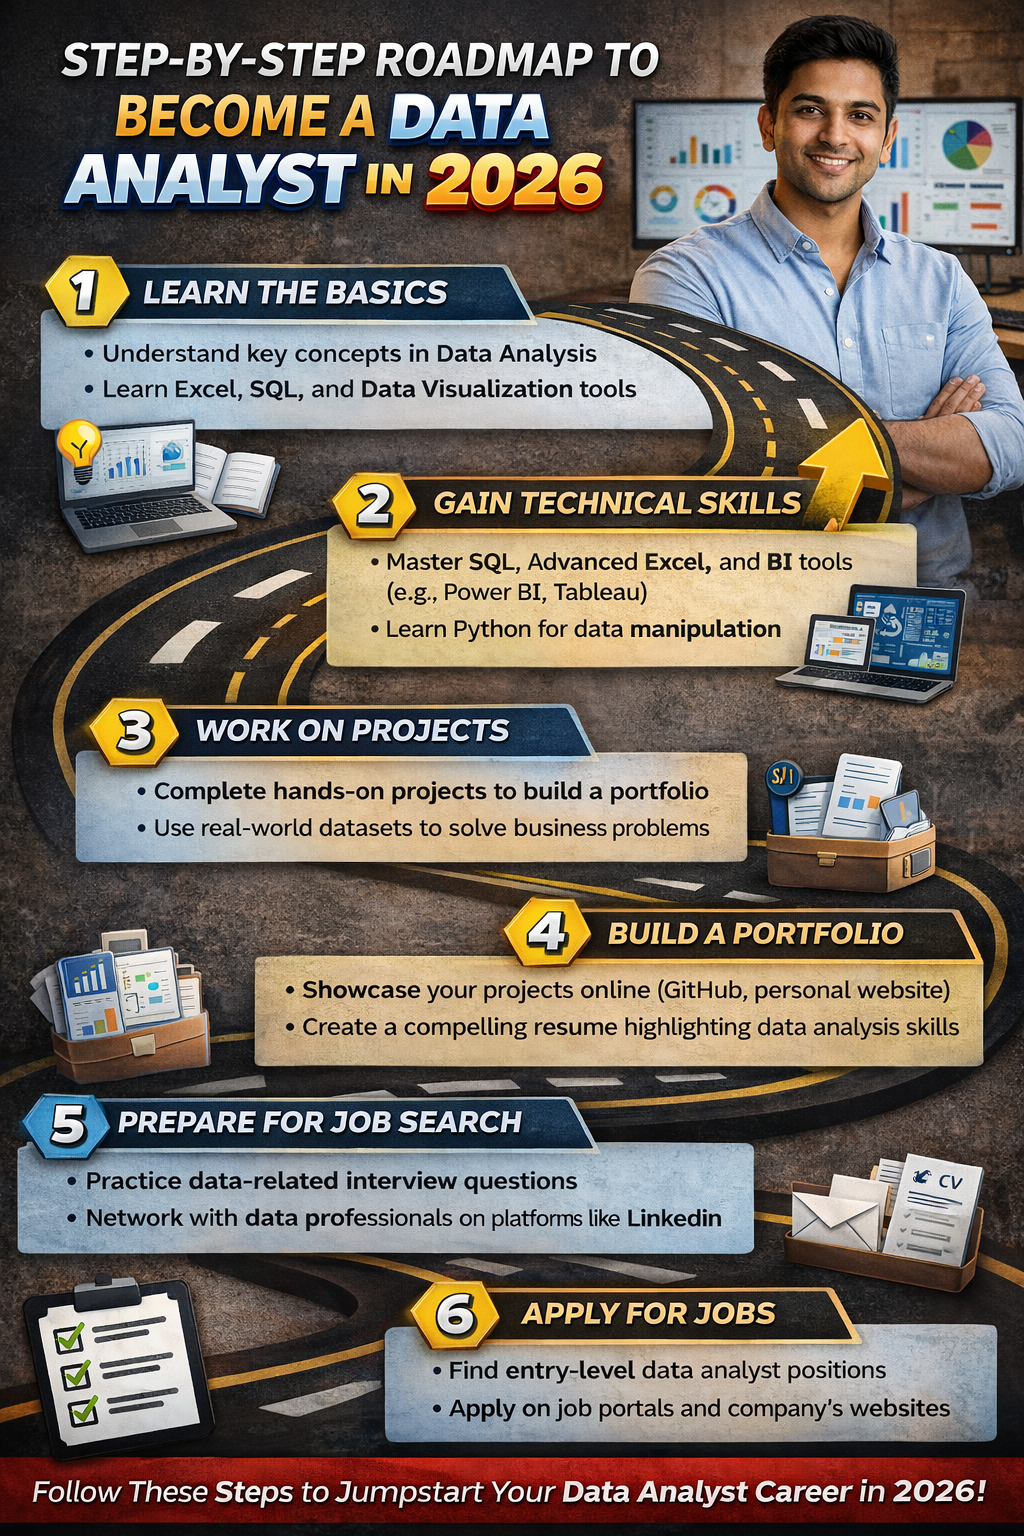
Step 1: Understand data basics and business metrics (Week 1)
In your first week, your goal is to learn how businesses measure performance. This matters because a data analyst is hired to support decisions, and decisions are usually driven by metrics.
What to learn?
- What are KPIs, metrics, dimensions, and measures
- The difference between leading metrics and lagging metrics
- Common business metrics you will see in analytics roles
- How to ask a good business question before analysing data
Metrics you should know early
- Revenue, costs, profit, margin
- Conversion rate and funnel stages
- Retention and churn
- Customer acquisition cost and customer lifetime value
- ARPU and cohort behaviour (basic understanding)
What to produce by the end of Week 1
- A one-page notes document listing 15 to 20 common KPIs with simple definitions
- A short case-style exercise: pick any app you use and write 5 business questions you would answer with data
Step 2: Master Excel for analysis (Weeks 2–3)
Excel is still one of the fastest ways to analyse data and communicate results. In many companies, you will still be asked for quick Excel outputs even if dashboards exist.
What to learn?
- Cleaning: removing duplicates, fixing formats, text-to-columns, data validation
- Core formulas: IF, IFS, SUMIF, COUNTIF, XLOOKUP or VLOOKUP, INDEX-MATCH, text functions
- Pivot tables and pivot charts
- Conditional formatting and basic report layouts
- Building a clean summary table and writing insights
Mini-project for Excel (end of Week 3)
Sales performance report
- Use any public sales dataset
- Create a pivot-based report showing revenue by month, region, and product category
- Add 3 charts that are easy to read
- Write 5 insights and 3 recommendations based on the data
What to produce by the end of Step 2
- One clean Excel file with analysis + charts
- A one-page insight note summarising what changed, why it matters, and what action you recommend
Step 3: Learn SQL properly (Weeks 4–6)
SQL is the most important skill for most data analyst jobs because it is how you access business data. Employers often shortlist candidates based on SQL alone because it shows you can work independently with real datasets.
What to learn?
- SELECT, WHERE, ORDER BY, LIMIT
- GROUP BY with aggregates like SUM, COUNT, AVG
- JOINs (INNER, LEFT), and when to use each
- CASE WHEN for conditional logic
- Subqueries and Common Table Expressions (CTEs)
- Basics of window functions (ROW_NUMBER, RANK, running totals)
- Data validation habits: checking duplicates, missing values, and unexpected spikes
Mini-project for SQL (end of Week 6): Customer and orders analysis
- Use any sample database with customers, orders, products, and dates
- Answer business questions such as:
- Which products drive the most revenue and repeat purchases?
- Which customer segments have the highest average order value?
- What is the month-wise trend of sales and repeat rate?
- Which regions have high sales but low retention?
- Write your queries cleanly and add comments so someone else can understand your logic
What to produce by the end of Step 3
- A single SQL file with 20 to 30 well-structured queries
- A short document summarising the key insights in plain language
- A simple table of KPIs: revenue, orders, repeat rate, AOV, top categories
Step 4: Learn dashboarding (Power BI or Tableau) (Weeks 7–8)
Dashboards help stakeholders track performance without asking you for the same report repeatedly. Companies value analysts who can build dashboards that are clean, fast, and decision-friendly.
What to learn?
- How to structure a dashboard: overview → drill-down → detail
- Filters and slicers, drill-through, and tooltips
- Basic calculated fields and measures
- Dashboard design principles: clarity, consistency, minimal clutter
- Building KPI cards and trend visuals the right way
Mini-project for Dashboarding (end of Week 8): KPI dashboard with filters
- Build a dashboard that shows:
- Overall revenue, orders, and conversion or repeat rate
- Trend line by month
- Breakdown by product category and region
- Top products and bottom products
- Add filters for time period, category, and region
- Ensure the dashboard answers a real question, not only displays charts
What to produce by the end of Step 4
- One finished dashboard file
- 5 written insights that a business team can act on
- A short “how to read this dashboard” note (this shows maturity)
Step 5: Learn basic statistics for analysts (Weeks 9–10)
Statistics help you avoid incorrect conclusions. As an analyst, you will often compare performance across time, segments, or campaigns. Basic statistics ensures you interpret patterns correctly and communicate uncertainty honestly.
What to learn?
- Descriptive statistics: mean, median, mode, percentiles, variance, standard deviation
- Correlation and why it does not prove causation
- Trend and seasonality basics
- Sampling basics and why sample size matters
- Confidence intuition: understanding whether a difference is meaningful or random noise
- Hypothesis testing basics: what p-values mean at a high level, and common mistakes
- Simple regression intuition: how to interpret relationships without overclaiming
Mini-project for statistics (end of Week 10): Insight and recommendation report
- Take a dataset with time and segments (marketing, sales, product usage, or finance)
- Compare two segments and explain whether differences are likely meaningful
- Identify trends and possible drivers
- Write recommendations and also mention what additional data would strengthen confidence
What to produce by the end of Step 5
- A short report with: question, analysis, findings, interpretation, and recommendations
- A section called assumptions and limitations (this makes your work credible)
Step 6: Add Python (optional but recommended) (Weeks 11–12)
Python is not mandatory for every data analyst job, but it is a strong advantage. It helps you work faster, handle larger datasets, and automate parts of reporting. It also makes it easier to grow into product analytics or data science later.
What to learn?
- Python basics and working in notebooks
- pandas: reading data, cleaning, filtering, grouping, merging
- Exploratory data analysis: summary stats, distributions, outliers
- Visualisation basics using a plotting library
- Writing reusable functions for repeated analysis tasks
Mini-project for Python (end of Week 12): End-to-end EDA + insights report
- Choose a dataset with enough depth (at least 10,000 rows if possible)
- Clean it, explore it, identify patterns, and build 5 to 7 clear charts
- Write a final summary: what the business should do next based on the data
What to produce by the end of Step 6
- A well-documented notebook or script
- A clean insights document written in plain languag
- A short README that explains dataset, questions, method, and findings
5 Projects That Can Help You Get Hired
Your portfolio is what proves you can do the job. In 2026, many candidates list tools, but hiring managers want to see whether you can take a messy dataset, answer business questions, and communicate insights clearly. You only need 4 to 5 strong projects, but they should look like real work.
A simple template to use for every project
- Business question: what you are trying to solve
- Dataset and tables: what data you used and what each table contains
- Cleaning and assumptions: what you fixed and what you assumed
- Analysis approach: SQL queries, Excel steps, or Python workflow
- Dashboard or charts: visuals that support decisions
- Insights: 5 to 8 clear insights in plain language
- Recommendations: 3 to 5 actions based on insights
- Limitations: what you could not confirm and what additional data you would need
Project 1: E-commerce funnel analysis and drop-off diagnosis
What will you do?
- Analyse user journey from visit → signup → add to cart → checkout → purchase
- Identify where users drop off the most and which segment is affected
- Suggest fixes based on the pattern
What makes this project strong – It shows you can think like a product or growth analyst and connect metrics to decisions.
Project 2: Customer retention and cohort analysis
What will you do?
- Build cohorts by signup month or first purchase month
- Measure retention and repeat rate across cohorts
- Identify which cohorts are improving or worsening and why
What makes this project strong – Cohort analysis is common in real analytics roles and shows structured thinking.
Project 3: Finance performance dashboard (revenue, cost, margin)
What will you do?
- Track monthly revenue, costs, gross margin, and profit
- Break down by category, region, or product line
- Highlight what is driving margin changes
What makes this project strong – It signals that you can work with business and finance teams, not only product data.
Project 4: Marketing channel performance (CAC, ROAS, conversions)
What will you do?
- Compare marketing channels on spend, conversions, CAC, and ROAS
- Identify the best and worst performing channels
- Recommend how to reallocate spend
What makes this project strong – Marketing analytics is widely available as entry-level work and has clear KPIs.
Project 5: Operations analytics (SLA, delays, defects, productivity)
What will you do?
- Analyse delivery time, service delays, defect rates, or resolution time
- Identify bottlenecks and variance across locations or teams
- Suggest process improvements and monitoring metrics
What makes this project strong – Operations analytics is a high-demand area and proves you can improve efficiency, not only track performance.
Build a Resume That Works for Data Analyst Roles (2026)
A strong data analyst resume is not a list of tools. It is proof that you can solve business problems using data. Your resume should quickly answer three questions: What tools can you use, what problems have you solved, and what impact did you create.
What sections to include?
- Summary (2 to 3 lines) focused on analytics skills and tools
- Skills (keep it short and job-relevant: Excel, SQL, Power BI/Tableau, Python if applicable)
- Projects (this is the most important section if you are a fresher or career switcher)
- Experience (if you have work experience, highlight data work even if it was not your job title)
- Education and certifications (only the most relevant ones)
How to write project bullets so they look like work experience
Use this simple format: action + tool + outcome + metric.
Examples of strong bullets
- Built a Power BI KPI dashboard to track monthly revenue, margin, and region-wise performance, reducing manual reporting effort by creating a single source of truth.
- Used SQL joins and CTEs to analyse repeat purchase behaviour and identified the top customer segment contributing to revenue concentration.
- Performed cohort retention analysis and highlighted a drop in week-4 retention for a specific acquisition channel, recommending changes in onboarding flow.
- Cleaned and validated a dataset with duplicates and missing values, ensuring consistent category mapping before reporting.
What to avoid in bullets
- “Worked on dashboard” or “Used SQL” without explaining what you achieved
- Long paragraphs that hide the result
- Too many tools listed without proof of usage
How to present projects professionally?
For each project, include:
- 1 line project title that sounds like a business problem
- Tools used
- 2 to 4 bullets showing what you did and what insight you found
- Link to dashboard, SQL file, or documentation if you have it
Common resume mistakes that reduce shortlist chances
- Writing a generic objective instead of a skills-based summary
- Listing 15 tools but having no strong projects
- Not mentioning SQL, or showing weak SQL proof
- Adding charts/screenshots without explaining insights
- Not tailoring resume keywords to the job description
- Poor formatting, too much text, and unclear section headings
Data Analyst Interview Preparation Guide 2026
Most data analyst interviews test four areas: SQL, Excel, dashboards, and business thinking. You do not need to be perfect in everything, but you must be reliable in SQL and clear in how you explain insights.
1) SQL interview preparation
What will be tested on?
- Aggregations and GROUP BY
- JOINs across multiple tables
- Filtering by time and segments
- CASE WHEN logic
- CTEs and subqueries
- Window functions basics (ranking, running totals) in many roles
- Writing clean queries and validating results
How to practice?
- Solve 30 to 50 SQL questions across difficulty levels
- After every query, cross-check with a small sample to confirm correctness
- Practice explaining your approach, not only writing the final query
2) Excel test preparation
What you will be tested on
- Cleaning and formatting data quickly
- Pivot tables and pivot charts
- Lookups and conditional formulas
- Building a short summary report with insights
- Basic charts with correct labels
How to practice?
- Take a dataset and time yourself to create a report in 30 to 45 minutes
- Focus on clarity and correctness over fancy design
3) Dashboard and visualisation questions
What will be tested on?
- Whether you can pick the right chart for the problem
- Whether your dashboard answers business questions
- Whether you understand filters, drill-downs, and measures
- Whether your dashboard layout is clear
How to practice?
- Build one dashboard and then improve it twice based on feedback
- Practice explaining how a stakeholder should use the dashboard
4) Business case and analytical thinking questions
These questions check whether you can translate a vague business problem into an analysis plan.
Common case prompts
- “Sales dropped last month. How will you analyse why?”
- “Retention is down for new users. What would you check first?”
- “Which marketing channel is best and why?”
- “How would you measure the success of a new feature?”
How to answer?
- Clarify the goal and metric first
- Break the problem into possible drivers
- Identify what data you need
- Explain the analysis steps in order
- Share what decision you would recommend based on likely outcomes
A simple 2-week interview prep plan
Week 1
- SQL practice daily (45 to 60 minutes)
- 2 Excel timed reports
- 1 case question practice per day
Week 2
- Mixed mock interviews: SQL + case + dashboard explanation
- Revise mistakes and build a final project summary you can speak confidently about
- Prepare 2-minute explanations for each portfolio project
Data Analyst Jobs and Internships (2026)
Getting shortlisted is mostly about two things: using the right keywords and showing proof (projects + clear resume). This section helps you find opportunities and apply in a way that actually works.
Best places to find data analyst roles
- LinkedIn Jobs: Use role keywords and apply consistently. Many entry roles are posted here first.
- Company career pages: If you have a target list of companies, apply directly. This often reduces competition compared to job portals.
- Internship platforms and early-career portals: Look for internships, analyst trainee roles, graduate programs, and apprenticeships. These can be easier entry points than full-time analyst roles.
- Referrals and networking: Referrals matter because analytics roles get many applications. A good referral combined with a portfolio link can increase your shortlist chances significantly.
Keywords to search (copy-paste list)
- Data Analyst, Junior Data Analyst, Associate Data Analyst
- Business Analyst (Data), Product Analyst, Marketing Analyst, Operations Analyst
- Reporting Analyst, MIS Analyst, BI Analyst
- SQL Analyst, Analytics Associate, Growth Analyst
- Power BI Analyst, Tableau Analyst
A simple LinkedIn strategy that works
Step 1: Fix your headline and about section
- Mention your target role and core skills clearly, for example: Data Analyst | SQL | Excel | Power BI | Portfolio Projects
Step 2: Pin your portfolio
- Add a featured section with links to your dashboard and project documentation.
Step 3: Post proof of work
- Once a week, share a small insight from a project. Even one chart with a short explanation helps recruiters see your capability.
Step 4: Apply with focus
- Apply to roles where your skills match at least 60 to 70%. Avoid applying randomly to everything.
Cold message format you can reuse
- 1 line: introduce yourself and your target role
- 1 line: mention your key skills (SQL, Excel, Power BI)
- 1 line: share your best project link
- 1 line: ask for a short guidance call or referral if appropriate
Example message
Hi, I am currently building my profile for data analyst roles and I work with SQL, Excel, and Power BI. I recently completed a project on customer retention cohort analysis and built a dashboard with actionable insights. If you have 10 minutes, I would love your guidance on what skills to prioritise for entry roles at your company. I can share my portfolio link as well.
A practical application target
- 10 focused applications per week
- 5 personalised messages per week
- 1 portfolio improvement per week
This keeps you consistent without burnout.
Career Growth Path and Salary for Data Analysts (2026)
Data analytics has one of the clearest growth paths because your value increases as you move from reporting to decision-making. Your salary increases fastest when you become strong in SQL, build business depth, and start owning outcomes, not only dashboards.
Typical career path
- Data Analyst (Entry): You mainly support reporting, KPI tracking, data cleaning, and ad hoc analysis. Your goal is to become fast and accurate with SQL and confident in explaining insights.
- Data Analyst (Mid-level): You begin owning metrics, building dashboards used by teams, and analysing drivers behind performance changes. You are expected to recommend actions, not only show results.
- Senior Data Analyst: You handle complex problems, mentor others, and work closely with leadership. You often own a business area such as retention, growth, revenue, or operations analytics.
- Analytics Lead / Analytics Manager: You manage stakeholders and sometimes a team. You define what should be measured, how dashboards and reporting should be structured, and how analytics should influence strategy.
Transition options from Data Analyst
- Product Analyst: More focus on user behaviour, funnels, experiments, and feature impact.
- Business Analyst: More stakeholder alignment, requirements, process improvement, and decision support.
- BI Developer / BI Engineer: More focus on dashboard engineering, data models, and reporting pipelines.
- Data Scientist (with extra learning): More focus on predictive modelling and advanced analysis.
What skills increase salary the fastest?
- Advanced SQL: Window functions, performance optimisation, and strong data validation habits.
- Dashboard maturity: Designing dashboards that drive decisions, not only display charts. Clear layouts, drill-downs, and correct metric definitions matter.
- Business depth in one domain: Pick one domain and become strong in it: product, finance, marketing, or operations. Domain expertise often pays more than learning a new tool.
- Experimentation and A/B testing basics: Even basic knowledge of how to measure impact can raise your profile.
- Python for automation: Automating reporting and analysis can make you more efficient and more valuable.
- Communication and stakeholder management: This is what moves you into senior roles. If you can explain insights simply and influence action, your salary grows faster.
How to move into higher-paying roles faster?
- Pick one niche: Product Analytics, Marketing Analytics, Finance Analytics, or Operations Analytics
- Build 2 projects in that niche that look like real business work
- Learn the KPIs and decision patterns used in that niche
- Practice case questions from that niche before interviews
Common Mistakes and How to Avoid Them
Most people do not fail because they are not smart. They fail because they learn in the wrong order, build weak projects, or cannot communicate insights clearly. Avoid these mistakes and your chances of getting shortlisted will improve sharply.
- Learning tools without building projects: If you only watch courses, you will not be job-ready. After every tool you learn, build one project that proves you can use it.
- Avoiding SQL or learning it superficially: SQL is the core skill for most analyst roles. Many candidates get rejected because they cannot write joins, CTEs, or clean aggregation logic confidently.
- Making dashboards without business insight: A dashboard is not the final output. The final output is a decision. Always write insights and recommendations along with your dashboard.
- Skipping data cleaning and validation: Wrong numbers destroy trust. Build the habit of validating totals, checking duplicates, and verifying logic before sharing results.
- Using too many tools and becoming average in all of them: It is better to be strong in Excel, SQL, and one dashboard tool than to list many tools with no depth.
- Weak communication: If you cannot explain what changed and why it matters in simple language, you will struggle in interviews and on the job. Practice writing short insight notes.
Expert Corner
To become a data analyst in 2026, focus on fundamentals, not shortcuts. Excel and SQL are your base. A dashboard tool helps you communicate. Statistics improve your judgement. Projects prove you can do the job. If you follow a structured plan and build 4 to 5 strong projects with clear insights, you will be in a strong position to get shortlisted for entry-level roles.