
In today’s fast-changing software testing landscape, JMeter continues to be one of the most trusted tools for performance testing. It helps testers replicate real-world user loads and analyze how systems hold up under pressure. Ever been in an interview where the questions felt more like riddles than technical queries? You’re not alone. When it comes to performance testing roles, Apache JMeter almost always makes an appearance—and success isn’t about memorizing theory but understanding how to handle real-world, scenario-based challenges. In this blog, we’ll dive into what the current job market expects from performance test engineers, the key skills companies value most, and the practical, scenario-driven JMeter interview questions you’re likely to face.
So, whether you are a fresher aiming to enter performance testing or an experienced tester looking to advance your career, mastering JMeter interview questions is crucial. This blog dives deep into the top 50 scenario-based JMeter interview questions, explores current job market trends, highlights sought-after skills, and offers expert tips to ace your interview and build a thriving career in performance testing.
JMeter Job Market Trends 2025
The software testing industry is witnessing significant growth, with market expansion expected at about 7.7% annually through 2037. Performance testing remains critical for ensuring applications can handle high user loads without breaking down, spearheaded by tools like JMeter. Moreover, companies adopting Agile and DevOps require testers to blend technical scripting skills with analytical thinking, making JMeter proficiency a highly valuable asset.
Career paths in performance testing range from entry-level roles to specialized niches such as Performance Test Architect and SDET (Software Development Engineer in Test), with salaries rising commensurately. As the cloud and AI integration into testing grows, JMeter experts who can adapt and automate testing processes are increasingly in demand across industries, including IT, finance, healthcare, and e-commerce.
JMeter / Performance Testing Roles
Before you jump into Q&A, it helps to understand the landscape:
- Growing demand for performance/load testing: As web and mobile applications scale, performance bottlenecks can cost businesses money and reputation. Companies are investing more in QA automation and performance testing, not just functional testing.
- DevOps / CI-CD integration: Performance testing tools (like JMeter) are often integrated into DevOps pipelines. If you know how to run JMeter tests via command-line / non-GUI, integrate with Jenkins/Bamboo/GitLab CI, or export metrics for dashboards, that’s a big plus.
- Cloud / distributed testing: Remote/distributed load generation (e.g. master-slave setups, cloud-based runners) is increasingly relevant. Knowing how to scale JMeter beyond a single machine helps.
- API-heavy architectures & microservices: With backends increasingly exposed via REST / GraphQL / microservices, JMeter isn’t just “web-page load testing” — you may need to stress-test APIs, simulate authentication, throttle rate limits, and measure SLA-style constraints.
- Hybrid roles (QA + SRE / Performance engineer): Rather than being purely QA, many performance-testing roles demand you monitor production metrics, interpret APM data (New Relic / Dynatrace etc.), or liaise with development/infra teams to resolve bottlenecks.
- Skills in demand: Beyond knowing JMeter’s buttons and menus, companies look for
- strong understanding of HTTP / network/connection behavior
- scripting/parameterization (CSV data feeds, dynamic variables)
- ability to analyze test results — response time distributions, error rates, throughput vs latency trade-offs
- knowledge of performance testing best practices (ramp-up, steady state, think times, ramp-downs)
- familiarity with distributed testing/monitoring/logging/reports
- collaboration skills: working with dev/infra / performance monitoring teams
If you can position yourself at the intersection of performance testing and continuous-delivery / observability, you’ll be highly valuable.
What Companies Look For in a Performance Testing / JMeter Role?
To win interviews, you should be able to demonstrate:
- Real-world experience: Show that you’ve executed tests against APIs, web apps, and databases. Share metrics. Show you’ve tuned and debugged scripts under load.
- Scenario-based problem solving: Interviewers like “what if X happens under high load” or “how do you test slow third-party APIs during peak traffic windows”. They want to see how you think, not just recite definitions.
- Scripting & automation: Ability to work without a GUI. Run JMeter from CLI. Integrate with version control, parameter files, build pipelines.
- Performance monitoring & reporting interpretation: Beyond raw metrics, you should understand what a “good” response time is, how to spot trends, how to estimate capacity, and how to recommend optimizations.
- Soft skills & documentation: Communicating test results to non-tech stakeholders, writing test plans, explaining trade-offs (e.g. ramp-up speed vs spike load), collaborating with developers / SREs.
- Adaptability: Handling changing requirements: e.g. authentication changes, dynamic data, multi-region performance variations, cloud vs on-prem environments.
If you can show you are comfortable under change and can think on your feet with JMeter scenarios, that gives you an edge.
Top 50 Scenario-Based JMeter Interview Questions & Answers
Below are 50 scenario-style questions divided by topic. For each question, you should not only know the “right answer”, but also be ready to explain why you make certain choices
Topic 1: Thread Group / Load Profile & Scheduling
1. You need to simulate 1000 concurrent users logging into a website within 5 minutes. What must be done in this case?
Answer: We should follow the steps below to meet the requirement –
- First, use a Thread Group with 1000 threads, ramp-up period = 300 seconds.
- Then, add an HTTP Request sampler for login. Use ramp-up to avoid all users hitting at once.
- Further, validate that login completes successfully (assertion).
- Lastly, monitor CPU / memory on server.
2. Your website’s peak traffic is from 9 AM to 10 AM daily. How to schedule that in JMeter?
Answer: We should follow the steps below to schedule –
- At first, enable the Scheduler on the Thread Group.
- Then, set Start Time = 09:00, End Time = 10:00 (or Duration = 1 hour).
- Optionally combine with a Constant Throughput Timer to maintain target throughput during that window.
3. You want to gradually increase the load from 100 users to 1,000 users over 30 minutes. What will you do?
Answer: We must perform the steps below to achieve the desired output –
- Use a ramp-up period that increases threads gradually.
- Then, you could divide the Thread Group startup in steps (e.g., stepping thread group plugin) or use multiple Thread Groups with increasing user counts.
4. You need to simulate a spike load of 5,000 users for 1 minute, then drop to normal traffic (500 users). What will you do?
Answer: We should use two Thread Groups: one for spikes witha large user count and short duration, another for baseline users. Or use plug-in like Stepping Thread Group. Then, add an appropriate tear-down ramp-down period. This will help meet the requirement
5. What should you do so that the Test runs continuously for 24 hours to find resource leaks under sustained traffic?
Answer: To run the test continuously for 24 hours to find resource leaks under sustained traffic we should –
- Thread Group with duration = 24 hrs, steady-state load.
- Use timers to simulate think-times. Monitor memory / GC on backend.
- Collect long-term latency, error trends.
6. How would you test with multiple time windows (e.g. morning, afternoon, evening) in the same test run?
Answer: We should use multiple Thread Groups, each with a scheduler/ timings. Or use a single thread group with custom scheduling logic (plugins or properties).
7. You want to throttle the rate of requests so that you send only 50 requests/sec, even though threads are many. What should you do?
Answer: We should use the Constant Throughput Timer or Throughput Shaping Timer plugin. Then, configure target throughput per minute/second.
8. You have users from two regions (Asia and Europe) with different peak hours; you need to simulate both in the same test plan. What will you do?
Answer: We will use separate Thread Groups for each region, with appropriate ramp-ups, delays and schedulers. Then, Parameterize base URLs accordingly.
9. Thread Group fails partway due to out-of-memory on JMeter host. What should you do to distribute the load across two machines?
Answer: We should follow the steps below to meet the requirement –
- We will set up distributed testing: master-slave JMeter instances.
- Then, Split user load among slaves.
- Further, ensure test plan, CSV files are synced.
- Lastly, monitor network latency to avoid skew.
10. You need to run the same load test nightly via Jenkins pipeline. How would you integrate JMeter scheduling + results archiving?
Answer: We should follow the steps below to meet the requirement –
- We will use JMeter in non-GUI mode via CLI. Use JMX file version-controlled.
- Then, trigger via Jenkins job.
- Save results (e.g. JTL files), parse aggregate results into reports, and send pass/fail criteria based on assertions or SLA thresholds.
Topic 2: Parameterization, Correlation & Data Handling
11. You have a login API that returns a session token in its response. Subsequent API calls need that token. How will you handle it?
Answer: We should follow the steps below to meet the requirement –
- We will use a Post-Processor extractor (e.g. JSON Extractor / Regular Expression Extractor) to fetch the token.
- Then, save to a JMeter variable.
- Use that variable in subsequent requests’ headers or bodies.
12. You need to test with user-specific CSV data (usernames/passwords). How would you ensure each thread picks a unique data row?
Answer: We will use CSV Data Set Config. Set sharing mode = “Each thread” or “All threads” as needed. Ensure file has more rows than threads if needed.
13. An API returns a paginated response. You want to iterate calls till “next page = null”. How do you loop dynamically in JMeter?
Answer: We should follow the steps below to meet the requirement –
- We will use a While Controller based on the response variable.
- Use JSON Extractor to determine if the “nextPage” field exists.
- Loop till the condition is satisfied.
14. You want to simulate different user flows based on user role (admin/user/guest). You have a CSV with a role column. How do you branch logic?
Answer: We will use CSV Data Set Config to read the role. Use If Controllers (or Switch Controller) to route to different sets of samplers based on the role variable.
15. You need to simulate file upload or large payloads for each user via API. How would you ensure the payload size is different per user?
Answer: We should follow the steps below to meet the requirement –
- Use CSV or a custom data file listing file paths/sizes.
- Parameterize the HTTP Request sampler to send the specific file.
- Use the JMeter File Upload configuration.
16. You want to test with random delays / think-times that vary per user or per transaction. What should you do?
Answer: We should follow the steps below to meet the requirement –
- We will use Timer elements like Uniform Random Timer or Gaussian Random Timer.
- Configure min & max delays.
- Place as a child of the sampler or controller.
17. Your test plan must accept environment-specific variables (e.g. base URL, credentials) without editing JMX. How do you externalize them?
Answer: We should follow the steps below to meet the requirement –
- We will use JMeter properties (user.properties / command-line
-Jproperty=value). - Use __P() functions inside your test plan.
- Use a separate property file per environment.
18. After a sampler fails under load, you want to retry that request up to 2 times before marking it failed. How can you do that?
Answer: Use “Loop Controller” with conditional logic (If Controller on failure flag), or implement retry logic via Beanshell / JSR223 sampler/processor. Or use the “Result Status Action Handler” plugin.
19. You need to correlate a CSRF token embedded in HTML page and send it in subsequent form-submit requests under concurrent threads. What should you do?
Answer: We will use HTML / XPath extractor / Regular Expression Extractor in Post-Processor, store CSRF token variable, pass it in the header or hidden field in the next request.
20. You want to parameterize headers (e.g. locale-specific Accept-Language or custom header per user) read from CSV. What should you do?
Answer: We will use the CSV Data Set Config for header values. Use Header Manager with JMeter variable placeholders from CSV.
Topic 3: Assertions, Validation & Error Handling
21. Under load, 5% of requests are returning HTTP-500 randomly. How do you capture that, alert on it, and fail the build?
Answer: We should follow the steps below to meet the requirement –
- We will use Response Assertion or HTTP Assertion to check the response code ≠ 500.
- Then, add a Listener to capture failures.
- Further, use the JMeter plugin or configure thresholds.
- In the CI script, parse the JTL file for error %, fail the build if the threshold is exceeded.
22. You want to assert that the response payload contains certain JSON fields for every request, but some fields are optional. How do you write assertions without failing optional cases?
Answer: We will use JSON Assertion or XPath / JSON Extractor + If Controller to check only when the field exists. Or write a JSR223 Assertion script to handle conditional logic.
23. You notice response times for certain API calls are climbing slowly over repeated loops. How do you detect gradual performance degradation?
Answer: We should follow the steps below to meet the requirement –
- We will use listeners that track response times over iteration count (e.g. aggregate report, Backend Listener to send metrics to external store).
- Plot trends.
- Set up thresholds on average/percentile delays.
24. During the test, one thread receives a malformed JSON response due to a backend caching issue. How do you log the offending request/response for debugging?
Answer: We will use “Save Responses to a file” listener / View Results Tree (in debug mode), or use JSR223 Post-Processor to write request & response to a log file when assertion fails.
25. You want the test to stop immediately if more than 10% of requests fail in the first 5 minutes. What should you do?
Answer: We will use “Startup Delay Thread Group” or a custom script that monitors error count via Beanshell / JSR223 sampler, or use a plugin like “Throughput Shaping + Assert plugin” to abort test based on threshold.
26. You want to check that the average response time remains below 300 ms, 95th percentile is below 500 ms under peak load. How do you enforce SLAs inside JMeter?
Answer: We will use JMeter’s “PerfMon / Statistics Recorder / Backend Listener” to capture percentile metrics; then, in post-processing (or via Beanshell/JSR223 Assertion) read the result metrics and fail the test if thresholds aren’t met. Or integrate witha CI plugin that parses JTL.
27. Some responses include HTML error pages under load, e.g. 502 Bad Gateway. You want to capture if those appear, even if HTTP status=200. How would you detect that?
Answer: Use Response Assertion on response body (e.g. search for “error” or known HTML fragment). Use Regular Expression / XPath / CSS-Selector in assertion.
28. You want to retry a failed request only if the assertion fails, else proceed. But track how many retries happened per thread. What should you do?
Answer: Combine Loop controller, If Controller based on failure flag, and counters (via User Defined Variables or Counter). Or use JSR223 script to increment the retry counter.
29. Under sustained load, occasional threads hang / deadlock. How do you detect & recover those threads during test?
Answer: We will use “Thread Group → Action to be taken after sampler error/thread error” setting. Use “Stop Thread / Stop Test” actions. Also, combine with assertion logic to monitor stalled response times and abort the test or notify the monitoring system.
30. You want to validate that database writes triggered by API calls complete within 2 seconds post-request. How do you incorporate DB-side validation in your load test?
Answer: After API request sampler, add JDBC Sampler to query the DB and check the write. Use assertion on query result time. Or include a Post-Processor JDBC Request that runs SELECT and validates timestamp difference.
Topic 4: Distributed Testing, Scaling & Monitoring
31. Your single-machine JMeter test shows resource limits; you want to scale to 5 machines. How do you configure a master-slave setup?
Answer: We will ensure the same JMX on all machines, same plugin versions, and classpath. Then configure “remote hosts” in the master’s jmeter.properties. Launch slaves. Start via CLI or GUI. Aggregate results at the master or viathe backend listener. Consider network latency, synchronization.
32. You want to run a test with geographically distributed load (one data center in India, another in the US). How do you coordinate and consolidate results?
Answer: We will use remote JMeter instances or cloud-based JMeter agents (AWS, Azure). Use Backend Listener to send metrics to the central metrics store (InfluxDB / Grafana). Then, correlate time zones and normalize timestamps.
33. You want to monitor server-side CPU / memory / GC metrics during test runs. How can you do that?
Answer: We will use the PerfMon metrics collector / JMeter PerfMon plugin. Configure agents on the server. Further, send data to the JMeter listener or external time-series DB. Then correlate metrics with request load.
34. You want to test for network latency (e.g. add artificial delay of 200 ms per request) to mimic slow user connections. What will you do in this case?
Answer: We will use JMeter “HTTP Request Defaults → Set Embedded Timer / Delay” or use “Constant Throughput Timer” with delays; or simulate via network emulator/proxy in front. Alternatively, on the JMeter side, use “Delay” timers.
35. Your team uses InfluxDB + Grafana for monitoring. You want JMeter to push metrics live into InfluxDB so dashboards show response times/throughput during the test. What should you do?
Answer: We will use a Backend Listener configured with an InfluxDB implementation. Then, set up host/port. Configure metrics to send. Further, visualize dashboards in Grafana.
36. You get inconsistent results when running tests via GUI vs CLI mode on the same machine. How do you investigate?
Answer: We should follow the steps below to meet the requirement –
- Check memory/heap settings (-Xmx, etc), ensure test plan uses non-GUI compatible elements.
- Check if any listeners are in the GUI block threads.
- Use same properties/configuration.
- Profile CPU / GC.
37. You want to simulate TLS handshake time differences (e.g., forcing slower TLS negotiation) to see its impact on user load. What will you do?
Answer: Use JMeter SSL / HTTP client settings (e.g. SSL session reuse, connection timeouts). Or use external tools to slow connection (test proxy). Measure the latency component breakdown.
38. You want to run a stress test that gradually increases load until the server fails, and detect the break-point (max concurrent users it supports). What must you do?
Answer: We will use increasing thread counts in sequence (e.g. via loop over Thread Groups or multiple test runs). Monitor error rate/response failures. Find the threshold where errors cross the acceptable percentage. Automate via scripting / CI.
39. You want to run the same test plan concurrently with different JVM settings on the SUT (system under test) to compare GC / performance impact. How would you meet the requirement?
Answer: Duplicate Thread Group or duplicate JMX with different parameters. Then, collect resource metrics via PerfMon. Compare latency/throughput curves per configuration.
40. Your test plan needs to scale up to 100,000 virtual users across multiple cloud agents. How do you design your test plan to avoid coordination overhead?
Answer: We will use modular test fragments. Avoid large payload logging in the listener. Use minimal listeners inside JMeter, push metrics externally. Use performant plugins, aggregate metrics via backend listener. Optimize sample result size. Use distributed agents with synchronized clocks.
Topic 5: Integration, CI/CD & Optimization
41. You need to run your JMeter tests as part of the pull-request pipeline and fail the build if the performance regression >10%. What will you do?
Answer: We should follow the steps below to meet the requirement –
- Trigger JMeter CLI via Jenkins/Bitbucket/GitLab CI. Parse JTL / XML / JSON output.
- Use threshold-checking script (shell / groovy / Python) to compare latest run stats with baseline.
- Fail pipeline if criteria exceeded.
42. Your test script has grown large and takes 30 minutes to run; you want to reduce the runtime while retaining coverage. What optimizations can you do?
Answer: We should follow the steps below to meet the requirement –
- We will use fewer iterations for low-priority test paths.
- Disable heavy listeners. Use more efficient logic controllers.
- Parameterize and reuse CSV instead of repeating loops.
- Run critical flows separately.
- Use distributed load to reduce wall-clock time.
43. You want to version-control your JMeter test scripts and ensure reproducibility across environments. What will you do?
Answer: Store .jmx files in Git. Use property files per environment. Use the CI tool to check out the correct branch/tag. Use command-line mode with the same JVM / plugin versions. Log JMeter version.
44. You want to automatically generate reports (graphs, percentiles) after each test run. What should be done?
Answer: We should follow the steps below to meet the requirement –
- We will use JMeter HTML Report generation (
-generate-dashboard), or integrate with external reporting tools (Grafana / InfluxDB). - Push to the shared folder or pipeline artifact.
- Publish via CI job UI.
45. Your test reports show that some response times have high variance. You want to identify the root cause—is it server-side DB, network, or code logic? How do you triage using JMeter?
Answer:
- Combine JMeter results with server-side metrics (CPU / DB queries/network latency).
- Use the PerfMon plugin on the server.
- Enable response headers/timing breakdown (connect time, DNS lookup, TLS handshake).
- Compare percentile distributions. Run isolated tests (DB-only, API-only) to narrow the root cause.
46. You notice thread starvation when you run many threads in parallel inside a JMeter test plan (timers not firing uniformly). How do you debug/optimize your test plan?
Answer: Inspect thread grouping/timers hierarchy. Remove heavy listeners inside test. Increase heap / adjust JVM options. Consider using more efficient timers. Try less GUI overhead. Run in non-GUI mode.
47. You want to parameterize the test plan to run with different user-load profiles without modifying JMX each time. What will you do?
Answer: We will use __P() properties inside JMX (for thread count, ramp-up, duration). Then, Pass values from CLI: jmeter -n -t test.jmx -Jthreads=500 -Jramp=60.
48. You want to ensure JMeter doesn’t cause false positives by caching DNS lookups. How do you reset the DNS cache during long-running tests?
Answer: We will use DNS Cache Manager with the “clear each iteration” option. Or programmatically flush DNS via JSR223 script.
49. Your performance testing needs to integrate with an APM tool (e.g. New Relic, Dynatrace). How do you correlate JMeter results with APM traces?
Answer: We should follow the steps below to meet the requirement –
- Ensure unique transaction IDs or custom headers in your requests.
- Tag your requests such that APM traces show them.
- Export correlation metrics (e.g. response times, error rates) and compare with APM data.
- Use a backend listener to send custom metrics to APM if supported.
50. Your test plan fails intermittently due to a memory leak in the JMeter plugin. How do you identify and fix it?
Answer: We should follow the steps below to meet the requirement –
- Run memory profiling on the JMeter host. Reduce listeners or reduce sample result retention.
- Upgrade plugin versions.
- Run smaller iterations and monitor GC & heap usage.
- Collect memory-profiling logs (e.g., using
-Xlog:gc).
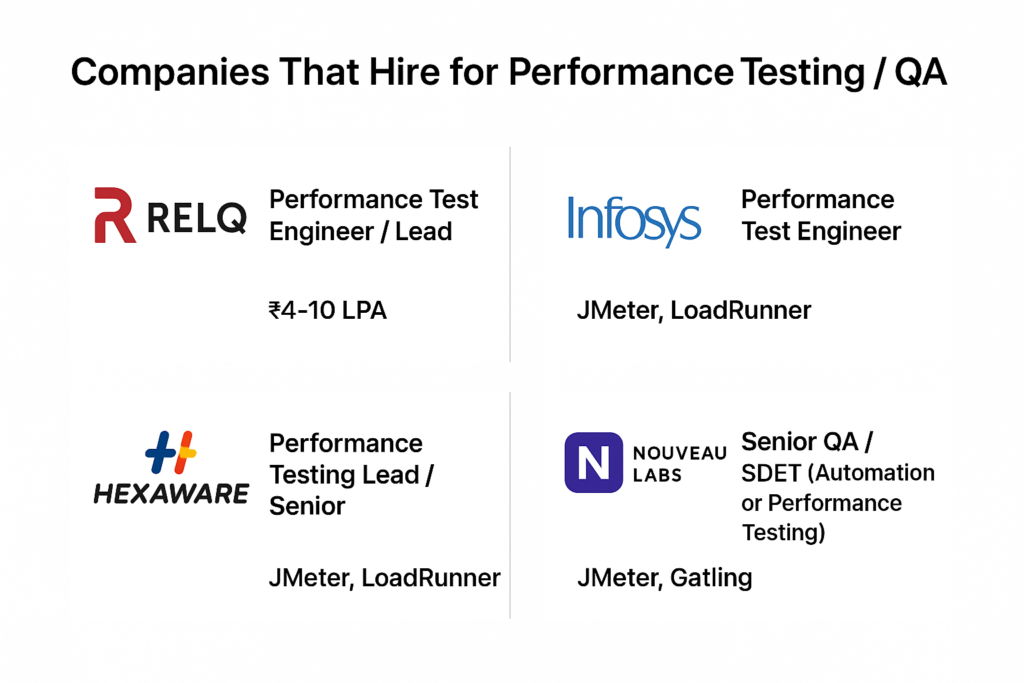
Companies That Hire for Performance Testing / Jmeter Job Roles 2025
Below are some real companies that post performance-testing / JMeter-oriented roles in India (or have significant QA / Performance Engineering teams), what they typically expect, and what the salary trends look like:
| Company | Role Examples | Skills & Requirements | Approx Salary / Notes |
|---|---|---|---|
| RELQ Technologies | Performance Test Engineer / Lead (Remote / Bengaluru) Glassdoor+1 | Hands-on JMeter scripting, analyzing performance bottlenecks, test plan creation, working with API / web-apps | Salary listed ~ ₹4–10 LPA for some Performance Test roles Glassdoor |
| Infosys | Performance Test Engineer | Required skills include JMeter (or other load testing tools), scripting / data handling, parameterization, CI/CD integration, performance monitoring tools (PerfMon / InfluxDB / Grafana or server-side metrics), ability to design test scenarios for real-world traffic/concurrency | Glassdoor shows various roles under Infosys, salary ranges around ₹4-6 LPA for junior to mid levels (in some listings) Glassdoor |
| Hexaware / Zensar / Wipro / Experian / EPAM | Performance Testing Lead / Senior / Test-Lead roles | Strong scripting ability, leadership/mentorship, experience with CI/CD, possibly multiple performance tools (JMeter / LoadRunner / NeoLoad), ability to own end-to-end performance testing strategy | These companies frequently show up in performance-testing job listings in India Indeed India+1 |
| Cutshort / Nouveau Labs (startup / product-company side) | Senior QA / SDET (with Performance Testing) | JMeter + other performance tools (Gatling, k6, etc.), test-automation exposure, ability to design performance test suites for API/backend, integration into CI/CD, possibly cloud or container contexts | One listing shows “Senior QA Engineer / SDET (Automation or Performance Testing)” with JMeter & Gatling in Bengaluru / Chennai region; pay up to ~ ₹35 LPA in that listing. |
| Generic / Market-wide | Performance Test Engineer (Entry / Mid / Lead) | Required skills include JMeter (or other load testing tools), scripting/data handling, parameterization, CI/CD integration, performance monitoring tools (PerfMon / InfluxDB / Grafana or server-side metrics), ability to design test scenarios for real-world traffic/concurrency | – Average salary for “Performance Test Engineer” roles in India is about ₹7.45 LPA (Glassdoor) Glassdoor – Performance Tester roles average ~ ₹9.03 LPA on Indeed in some listings Indeed India – Salary for a performance tester range vary substantially depending on experience level Glassdoor+1 |
Skills to Highlight in a Job Application
- Explicit mention of performance testing toolset — JMeter is good; bonus if you know more (LoadRunner, NeoLoad, Gatling, etc.).
- Evidence of integrating performance tests into CI/CD / DevOps pipelines (Jenkins, GitLab CI, Azure DevOps etc.).
- Familiarity with performance-monitoring or metrics tools (PerfMon plugin, InfluxDB + Grafana, server metrics coupling).
- Experience handling realistic load (e.g. thousands of users, distributed / cloud-based agents).
- Reporting & analysis skills — not just “ran load”, but “identified bottleneck X, suggested code/infra tune, achieved improvement”.
- Leadership / senior roles may expect mentoring juniors, defining test strategy/standards, or coordinating with SRE / Dev teams.
- Soft skills: writing test plans, documenting non-functional requirements (NFRs), liaising with stakeholders about SLA / capacity planning.
How to Prepare for a Performance Testing / JMeter Interview?
To increase your chances of success, it helps to prepare not only technically but mentally & organizationally. Here’s a “prep playbook” you can follow:
| Step | What to Do |
|---|---|
| 1. Research the Company & Role | Go through scenario-style questions (like those in your blog). Practice explaining why you pick particular thread counts/timers/assertions/schedulers. It’s not enough to know “what”, you must justify “why”. |
| 2. Rehearse Scenario-Based Thinking | Be ready to discuss: “Have you handled a performance issue that slipped into production?” or “What trade-offs have you accepted (e.g., increasing throughput vs cost)?”. Also, project planning: how you estimate how many threads/users you need, what monitoring you set up, how you communicate results to developers or managers. |
| 3. Build or Polish Your Portfolio / Projects | Practice explaining your test design/choices to a friend or peer. Ask someone to “poke holes” in your logic: “What if the server fails? What if response times spike after 2 hours? How would you alert/abort the test?” |
| 4. Mock Interviews / Peer Review | If you don’t already have one, build a sample project: e.g., design a JMeter test plan for an API (say login → fetch data → high-volume search), integrate it with CLI mode, and generate a report dashboard (HTML or using InfluxDB + Grafana). Put this on GitHub or your personal portfolio. |
| 5. Prepare for Non-Technical Questions Too | Examples: “What is your typical peak load/traffic?” “How do you monitor production performance today?” “What is the biggest performance challenge your team faced recently?” These show you are thinking beyond writing test plans. |
| 6. Make Sure Your Environment & Tools Are Available | On your laptop / VM: install JMeter (latest stable), set up a few sample test plans, configure property-file externalization, maybe hook up a simple monitoring dashboard (local instance of InfluxDB + Grafana if feasible). Even if you don’t demo it, knowing how it works end-to-end helps during “whiteboarding / take-home tasks”. |
| 7. Refresh Supporting Concepts | Brush up on HTTP / networking basics (latency, payload size, connection reuse), JVM / Garbage Collection (if you need to explain why response times drift), OS / CPU / memory impact under load, and basics of throughput vs latency vs error rates. |
| 8. Prepare Questions to Ask the Interviewer | Examples: “What is your typical peak load / traffic?” “How do you monitor production performance today?” “What is the biggest performance challenge your team faced recently?” These show you are thinking beyond writing test plans. |
| 9. Revisit Your Resume for Relevance | Highlight project(s) where you used JMeter to find or fix performance issues. Quantify results. Emphasize automation & continuous-integration aspects if present. If you used monitoring tools or dashboards (Grafana / Influx / PerfMon), list them. If you improved performance by X %, mention that. |
| 10. Stay Updated on Trends | Performance testing is evolving: “shift-left” performance testing (earlier in development lifecycle), performance testing for microservices/containers / cloud-native architectures, API-first performance checks. Be ready to discuss how you might test containerized applications, serverless endpoints, or distributed services. |
Resume Tips to Get JMeter Jobs
Here are a few practical tips for building a resume that gets noticed:
- Quantify Your Impact: Instead of “used JMeter for load testing”, write: “Designed & executed JMeter load test simulating 10,000 users over 1 hour — detected 15% latency increase at peak, which led to server tuning that reduced response time by 20%.”
- Structure by Project/Scenario: Under each role or project, briefly describe the scenario, user load, duration, failures observed, what you did (timers/assertions/parameterization), outcome or fix you suggested.
- List relevant tools & environment: Include JMeter version, relevant plugins used, monitoring stack (e.g. InfluxDB / Grafana), CI/CD tools (Jenkins / GitLab), any scripting languages used (Groovy / Beanshell / Python).
- Highlight non-GUI automation: Emphasize experience running JMeter in non-GUI / CLI mode, integration with pipelines, property-file use, and externalized parameterization.
- Show learning & continuous improvement: If you’ve upgraded test plans (e.g., using plugins/custom assertions), benchmarked across environments, or improved monitoring dashboards — include that.
- Keep clarity & consistency: Use consistent metric units (ms/seconds), clearly state test durations, concurrency, throughput, etc. Make it easy for the interviewer or hiring manager to visualize what you did.
Expert Corner: Pro Tips
- Always maintain a baseline load — know what “normal usage” looks like, so you can show before/after comparisons.
- Simulate real user wait/think times rather than hammering requests as fast as possible.
- Use version control for your
.jmxscripts and treat test plans like code. - Automate threshold checking — don’t rely on manual review of reports; failures based on SLA should be flagged automatically.
- Monitor infrastructure during performance test (CPU / memory / DB locks etc) — correlating load metrics with server metrics often uncovers root causes faster.
- Stay updated with newer JMeter plugins & best practices (e.g. newer listeners, newer timers, more efficient scripting via JSR223 / Groovy).
- Conduct post-mortems of test runs — when performance fails, document root cause, resolution, and update your test plan or thresholds accordingly.
- Practice mock interviews around scenario-based performance questions with peers — being able to “think on your feet” under pressure helps more than memorising static Q&A.