
When one thinks of economics the first words that come to mind are price and demand. Almost every economic action in our daily life is based on the relationship between price and demand. When the price of tomatoes rises from Rs. 30 to Rs. 50 per kg, in all likelihood, your mum will purchase less quantity of tomatoes. This means her demand for tomatoes falls. What happens when the price of Cadbury chocolates fall? Kids buy more of it. Thus, the demand for chocolates rises. These everyday phenomenons can be explained by one of the most basic laws in economic theory. It is called the Law of Demand.
The Law of Demand puts into a statement the relationship between goods and services and their prices. To understand the law of demand one must first know what the demand function means. The demand function gives us the relationship between demand for a commodity and other factors such as price, technology, related goods, tastes and preferences and miscellaneous.
The law of demand states, ‘other factors remaining constant, the price of a commodity is inversely related to demand’. This means, when the price of a commodity increases the demand for that commodity will fall and when the price of the commodity falls, the demand for that commodity will rise.
The following is a demand schedule that illustrates the law numerically.
| PRICE | QUANTITY |
| 10 | 60 |
| 20 | 50 |
| 30 | 40 |
| 40 | 30 |
| 50 | 20 |
| 60 | 10 |
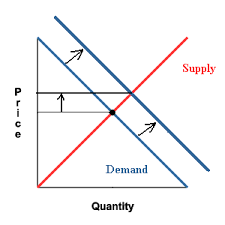
The negative relationship between price and demand can be graphically explained by the demand curve. The demand curve is a downward sloping curve
There are two main phenomenon related to the demand curve: (i) Movement (ii) Shift
- MOVEMENT
Movement occurs when there is a change in demand on account of change in price (other factors remaining constant). When price of a commodity increases, the demand falls and there is an upward movement along the demand curve which indicates ‘contraction’ of demand. When the price of a commodity falls, the demand increases and there is a downward movement along the demand curve which indicates ‘expansion’ of demand.
- SHIFT
Shift occurs when there is a change in demand on account of change in other factors (price remaining constant). When there is a change in other factors, for example, a favourable change in taste and preferences with respect to a certain commodity, the demand for the commodity increases. This leads to a rightward shift of the demand curve indicating ‘increase’ in demand. A ‘decrease’ in demand is a representation of the opposite phenomena.


14 Comments. Leave new
Informative !
🙂
Good.
good effort!
nice work!!
good job!
Well written!
Informative
you have explained a complicated topic very well
nice work
Great!
very well written Elesha 🙂
Well explained!
Informative 😀
Found something new for mw 😀
Explained the concept very well.