
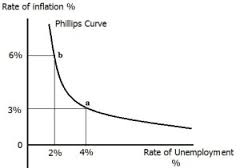
Earlier it was believed that economies faced either inflation or unemployment but not together and whichever was dominating at that particular period dictate which macro policy objective to pursue. But in 1958 A.W. Phillips plotted an inverse relationship between rate of inflation and rate of unemployment . When unemployment was high inflation was low and when unemployment was low inflation was high. He analyzed data for annual wage inflation and unemployment of UK for the period 1860-1957 and a downward sloping scatter plot was obtained. The name “Phillips Curve” was labeled by Samuelson and Solow after they replicated Phillips exercise for US using data from 1900 to 1960. Similarly many economists from other countries undertook similar research and found similar results for their economies.
Now economies were actually able to perform the trade-off between inflation and unemployment. During 1960’s and 70s it was common practice for governments around the world to select a rate of inflation they wished to achieve. The policy became known as stop-go and believed strongly on fiscal policy to create the required expansions and contractions.
In 1970 however, the relation broke down. In US and many other countries, economies faced both high inflation and high unemployment which contradicted Phillips Curve. Friedman and Phelps both American economists proposed one explanation namely that there is not one Phillips curve, but a series of short Run Phillips curve and a Long Run Phillips curve which exists at the natural rate of unemployment. Indeed in the Long Run there is no trade-off between the two. The breakdown of Phillips Curve was also explained in terms of Non Accelerating inflation Rate of Unemployment (NAIRU). NAIRU which exists at the long run Phillips curve is the rate of unemployment at which inflation will stabilize i.e price rise at the same rate each year.
But a relation reappeared but now the relationship was between unemployment rate and CHANGE in the inflation rate, i.e today in US high unemployment leads not to low inflation, but to a DECREASE in inflation.
Does the trade-off still exists?
Between 1993-2008, unemployment fell to record lows, but inflation did not rise, as predicted by Phillips Curve. Many economists explains this by successful supply-side policies. But statistics for UK inflation and unemployment support the view that extreme trade off between unemployment and inflation that occurred in the past no longer exists. Much more effective supply side reforms by UK has resulted in expansion without experiencing inflation. Improvements in labour market flexibility have helped along with labour immigration. Also independence of the Bank and England has played a role in ‘reducing expectations’ of inflation and weakening the link between current and future inflation.
But again we cannot say that Phillips curve has disappeared completely. The relation reappeared during 2007-2009 with unemployment rising and inflation decreasing.


18 Comments. Leave new
Informative!!
Well written..!
Nice article.
Nice.
very well articulated
nice
This is a very interesting topic!
Well articulated
Great work!
You make it easier for those, to understand, who always escape from this topic(like me). 😛
Nice article..
nicely explained.
Very informative article.
very well explained
Nicely written.
Keep it up, Prachi!
informative and very well explained 🙂
seems i am reading my academic books. Though nicely explained