
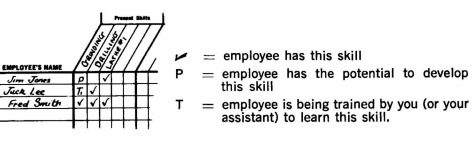
When you’re under time pressure, it can be difficult to make work assignments efficiently. You may forget that Tom, who is temporarily out of your sight, might be the best man for a given assignment, and you may put Harry on it instead. The results may be unsatisfactory. A simple chart can take some of the hit-or-miss quality out of job assignments. Here’s a sample:
You make the chart work by these steps:
■ Step 1. List each employee on your staff down the left-hand column.
■ Step 2. List each task or operation in your area, one task to a column, as in the chart.
■ Step 3. Using the symbols “A,” “B,” or “C,” give each employee a rating for each departmental task, if that employee is at all able to do the task.
Meaning of the symbols
- A: Fully competent.
- B: Knows the operation but needs a few pointers.
- C: Can do the job, but only with supervision or with the assistance of a co-worker.
The rating symbol should be entered in the space opposite the employee’s name and below each job. If he can’t handle the job at all, leave the space blank. When the chart is fully filled out, you may want to decide that you’ll use “C” people only in pinches—when the work just has to be done and there’s no one else to do it. You may also want to establish restrictions on the use of “B” people.
Generally, assign “A” people, unless there’s a reason for not so doing—lack of availability or higher-priority assignments. The chart can have a secondary use: pinpointing training needs. If you don’t have enough “A” people for a given task, it might be a good idea to undertake to upgrade the skills of “C” and “B” individuals.
Planning Guide
This form is illustrative only. In the average case, a plan for a project of any size would require many pages.
6 Ways to Manage Planning at Workplace
Here’s a brief checklist to use before, during, and after planning. It can pinpoint a weakness, eliminate a kink that might wreck an effective program.
1. Should you subdivide?
You may benefit by dividing a large-scale program. Each sub plans is parcelled out to a competent subordinate. The advantages:
(a) no one man is snowed under by a load of details;
(b) you benefit from the ingenuity of others and your people will cooperate more fully because they’ve had a voice in planning.
2. Do you need an alternative plan?
There are cases in which you must not fail. It’s certainly a good idea to backstop yourself: locate a source for additional equipment; or, train extra people who can lend a hand, just in case.
3. How far can you pretest?
Engineers have shown the way: . . . Rough planning. Before you get lost in details, block out the program in its basic form. Suppose you are trying to develop a better method of indoctrinating new employees. It may be enough to simply work out four or five basic areas to be covered such as:
- (a) introductions to other employees;
- (b) helping the newcomer to get acquainted with physical layout, wash-rooms, etc;
- (c) reviewing department functions;
- (d) reviewing company history;
- (e) explaining his function in the scheme of things. … Dry run.
Where feasible, a run-through of your plan helps you check methods, procedures, reactions. … Models. Want to see your troubles before they get to you?
No matter how well you can visualize, it pays to use—a. Scale models. Let’s say you’re planning a new floor layout. You can spot flaws by laying out the room dimensions and using cardboard cutouts to represent equipment, workstations, and employees. Insufficient space in the aisles, the awkward relationship of equipment, etc., will be revealed. b. Working models. By having a carpenter make up one version of a projected auxiliary warehouse, an executive could check for feasibility. … Component tests. When your car is serviced, it’s under the microscope piecemeal: motor, tires, control mechanisms. Similarly, if your plan were to involve a series of report forms, you could scrutinize each one to see how well it furthers your overall objectives.
4. Should you bring in your assistant?
The quickest way for a subordinate to develop a broader view of departmental problems is for you to delegate part of the planning to him. Do you have anyone you want to develop in this fashion?
5. Should you “step-plan”?
The situation may not allow you to layout a complete course of action. Your efforts may involve two or more phases. You may have to stop after each part has been completed to appraise results before you can map the next step. Know the reassessment points in advance.
6. Does your plan need booster-shots?
Programs once started tend to run out of gas. If your plan covers an extended period of time, keep in mind the possible need to remotivate your people.
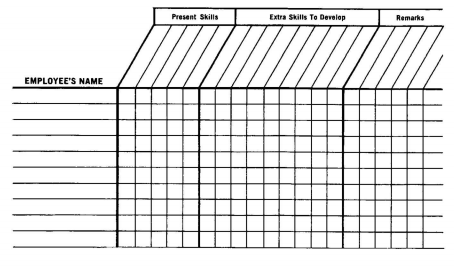
Employee Skills Developer
List the names of staff members whose skills you would like to improve. Under the section titled “Present Skills,” list the various skills used in your departmental operations. Under the next section, titled “Extra Skills To Develop,” list the skills you anticipate will be needed in the near future. Then, fill out the chart, using the following suggested code—
To indicate the state of the employee’s training, you may want to use a simple rating from 1 to 5, with 1 equalling the beginning of training, 5 equalling the final stage. Thus you might put a T3 next to an employee who is midway in training.
Plans for Training. Many executives consider training to be a continuing process. Even so, changes in overall company plans or changes in departmental operations may dictate “emergency” training programs. In either case, the questions below can suggest worthwhile points for action.
1. Are the right people doing the training in your department?
k. Assemble cap on one end of tube.
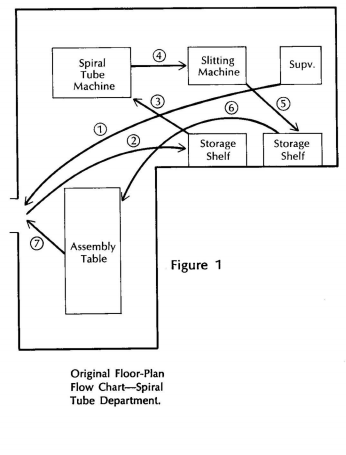
I. Final-inspect tubes. m. Pack and send to Shipping. When you’ve written out the steps, show the flow of the work, as in the drawing below.
3. Making an Improvement
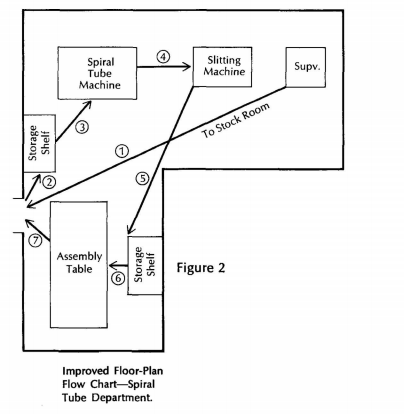
The Floor-Plan Flow Chart can pay off substantially. In the situation illustrated (see Figure 1), the production head saw that the work was moving too long a distance, so he redid his drawing, and the actual arrangement, to look like Figure 2.
Note the improvement: by changing the location of the storage shelves, the distance between operations was cut considerably. Of course, it’s unwise to carry out such changes without consulting your subordinates, who may resent being left in the dark. To over-come any kickback later, give them the chance to work with you on improving the weak spots revealed by the chart. It’s particularly advisable because the changes you’re liable to make are the kind that affect
Attendance Analyzer
Insert the appropriate information. An explanation for calculating an absentee rate (note the formula along the bottom of the chart) will be found in detail after the form. You may want to duplicate this form and use one copy at the end of each month.
Directions for calculating absentee rate:
If absence is a serious problem for you, we recommend that you duplicate the form above and keep accurate records, month to month. Executives find that record-keeping is often, of itself, a helpful remedy for diminishing absenteeism.
The chart provided is self-explanatory, though a note should be added about the column marked “Result of Discussion.” It is based on the notion that it is a good practice to have a returning employee see his superior before starting back to work. This interview will not only tell you the reason for the absence, but impress the employee with your concern. The Absentee Rate is found by
1) taking the man-days lost in your department,
2) dividing them by the man-days scheduled, and
3) multiplying that figure by 100.
Here is how one manager performed this calculation, a man with twenty employees in the department, each scheduled to work eight hours a day, twenty-four days a month. At the end of one month, recently, he found that seven of his employees hadn’t been absent at all, but that five had been out one day each; four two days each; three days each; and one man, twenty days. So he roughed out the following chart:
No. Of employees days absent man-days lost 7 0 0 5 1 5 4 2 8 3 3 9 1 20 20 total 42
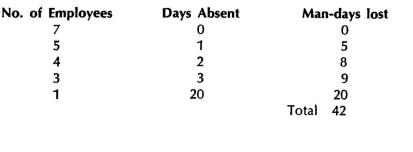
Next, he figured out the number of man-days that were scheduled for this month: he multiplied the number of people in his department (20) by the number of workdays in the month (24), to get 480. Filling in the formula, this manager’s final calculation was: 4480 2 X 100 = 8.75% An 8.75% absentee rate is very high (the national average is 4%).
If your rate rises above 4% for any month, consider this recommendation: Concentrate on the men with the highest number of absences, whether excused or unexcused. Studies show that these same men will be repeaters unless checked.
Get ready to enhance your skills and become a Certified Personal Competencies for Leadership Skills Now!