Tableau is a Business Intelligence tool for visually analyzing the data. Users can create and distribute an interactive and shareable dashboard, which depict the trends, variations, and density of the data in the form of graphs and charts. Tableau can connect to files, relational and Big Data sources to acquire and process data. The software allows data blending and real-time collaboration, which makes it very unique.
Tableau offers five main products catering to diverse visualization needs for professionals and organizations. They are:
- Tableau Desktop: Made for individual use
- Tableau Server: Collaboration for any organization
- Tableau Online: Business Intelligence in the Cloud
- Tableau Reader: Let you read files saved in Tableau Desktop.
- Tableau Public: For journalists or anyone to publish interactive data online.
Tableau Desktop
Tableau Desktop has a rich feature set and allows you to code and customize reports. Right from creating the charts, reports, to blending them all together to form a dashboard, all the necessary work is created in Tableau Desktop.
For live data analysis, Tableau Desktop provides connectivity to Data Warehouse, as well as other various types of files. The workbooks and the dashboards created here can be either shared locally or publicly.
Based on the connectivity to the data sources and publishing option, Tableau Desktop is classified into
- Tableau Desktop Personal: The development features are similar to Tableau Desktop. Personal version keeps the workbook private, and the access is limited. The workbooks cannot be published online. Therefore, it should be distributed either Offline or in Tableau Public.
- Tableau Desktop Professional: It is pretty much similar to Tableau Desktop. The difference is that the work created in the Tableau Desktop can be published online or in Tableau Server. Also, in Professional version, there is full access to all sorts of the data type. It is best suitable for those who wish to publish their work in Tableau Server.
Tableau Public
It is Tableau version specially build for the cost-effective users. By the word “Public,” it means that the workbooks created cannot be saved locally, in turn, it should be saved to the Tableau’s public cloud which can be viewed and accessed by anyone.
There is no privacy to the files saved to the cloud since anyone can download and access the same. This version is the best for the individuals who want to learn Tableau and for the ones who want to share their data with the general public.
Tableau Server
The software is specifically used to share the workbooks, visualizations that are created in the Tableau Desktop application across the organization. To share dashboards in the Tableau Server, you must first publish your work in the Tableau Desktop. Once the work has been uploaded to the server, it will be accessible only to the licensed users.
However, it’s not necessary that the licensed users need to have the Tableau Server installed on their machine. They just require the login credentials with which they can check reports via a web browser. The security is high in Tableau server, and it is much suited for quick and effective sharing of data in an organization.
The admin of the organization will always have full control over the server. The hardware and the software are maintained by the organization.
Tableau Online
As the name suggests, it is an online sharing tool of Tableau. Its functionalities are similar to Tableau Server, but the data is stored on servers hosted in the cloud which are maintained by the Tableau group.
There is no storage limit on the data that can be published in the Tableau Online. Tableau Online creates a direct link to over 40 data sources that are hosted in the cloud such as the MySQL, Hive, Amazon Aurora, Spark SQL and many more.
To publish, both Tableau Online and Server require the workbooks created by Tableau Desktop. Data that is streamed from the web applications say Google Analytics, Salesforce.com are also supported by Tableau Server and Tableau Online.
Tableau Reader
Tableau Reader is a free tool which allows you to view the workbooks and visualizations created using Tableau Desktop or Tableau Public. The data can be filtered but editing and modifications are restricted. The security level is zero in Tableau Reader as anyone who gets the workbook can view it using Tableau Reader.
If you want to share the dashboards that you have created, the receiver should have Tableau Reader to view the document.
Tableau Working
Tableau connects and extracts the data stored in various places. It can pull data from any platform imaginable. A simple database such as an excel, pdf, to a complex database like Oracle, a database in the cloud such as Amazon webs services, Microsoft Azure SQL database, Google Cloud SQL and various other data sources can be extracted by Tableau.
When Tableau is launched, ready data connectors are available which allows you to connect to any database. Depending on the version of Tableau that you have purchased the number of data connectors supported by Tableau will vary.
The pulled data can be either connected live or extracted to the Tableau’s data engine, Tableau Desktop. This is where the Data analyst, data engineer work with the data that was pulled up and develop visualizations. The created dashboards are shared with the users as a static file. The users who receive the dashboards views the file using Tableau Reader.
The data from the Tableau Desktop can be published to the Tableau server. This is an enterprise platform where collaboration, distribution, governance, security model, automation features are supported. With the Tableau server, the end users have a better experience in accessing the files from all locations be it a desktop, mobile or email.
Tableau Server Architecture
The various layers used in the Tableau server are given in the following architecture diagram
Tableau Architecture Diagram
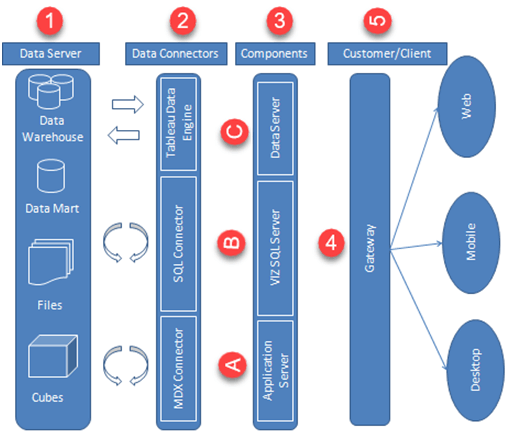
- Data Server
- Data Connectors
- Tableau Server Components
- Application Server
- VizQL Server
- Data Server
- Gateway
- Clients
Data Server – The primary component of Tableau Architecture is the Data sources it can connect to it. Tableau can connect to multiple data sources. These data sources can be on-premise or remotely located. It can connect to a database, excel file, and a web application all at the same time. Tableau can connect data from heterogeneous environments. It can blend the data from multiple data sources. It can also make the relationship between various types of data sources.
Data Connectors – The Data Connectors provide an interface to connect external data sources to Tableau Data Server. Tableau has in-built ODBC/SQL connector. This ODBC Connector can connect to any databases without using their native connector. Tableau has an option to select both live and extract data. Based on the usage, one can be easily switched between extracted and live data.
- Live Connection or Real time data: Tableau can connect to real time data by linking to the external database directly. It uses the infrastructure of existing database system by sending dynamic MDX (Multidimensional Expressions) and SQL statements. This feature can link to the live data with Tableau rather than importing the data. It makes good the investment done by an organization on a fast and optimized database system. In many enterprises, the size of the database is huge and is updated periodically. In those cases, Tableau works as a front-end visualization tool by connecting to the live data.
- Extracted or In-memory data: Tableau has an option to extract the data from external data sources. We can make a local copy in the form of tableau extract file. It can extract millions of records in Tableau data engine with a single click. Tableau’s data engine uses storage such as RAM, ROM and cache memory to store and process data. Using filters, Tableau can extract few records from a huge dataset. This improves the performance, especially while working on massive datasets. Extracted or in-memory data allows the users to visualize the data offline, without connecting to the data source.
Application Server – The application server is used to provide the authentications and authorizations. It handles the administration and permission for web and mobile interfaces. It assures security by recording each session id on Tableau Server. The administrator can configure the default timeout of the session in the server.
VizQL Server – VizQL server is used to convert the queries from the data source into visualizations. Once the client request is forwarded to VizQL process, it sends the query directly to data source and retrieves information in the form of images. This image or visualization is presented to the user. Tableau server creates a cache of visualization to reduce the load time. The cache can be shared across many users who have the permission to view the visualization.
Data Server – Data server is used to manage and store the data from external data sources. It is a central data management system. It provides metadata management, data security, data storage, data connection and driver requirements. It stores the relevant details of data set such as metadata, calculated fields, sets, groups, and parameters. The data source could extract data as well make live connections to external data sources.
Gateway – The gateway channelizes the requests from users to Tableau components. When the client makes a request, it is forwarded to external load balancer for processing. The gateway works as a distributor of processes to various components. In case of absence of external load balancer, gateway also works as a load balancer. For single server configuration, one primary server or gateway manages all the processes. For multiple server configurations, one physical system works as primary server while others are used as worker servers. Only one machine can be used as a primary server in Tableau Server environment.
Clients – The dashboards and visualizations in Tableau server can be viewed and edited using different clients. The Clients are Tableau Desktop, web browser and mobile applications.
| Clients | Environment |
| Tableau Desktop | Tableau Desktop is a business analytics tool. It helps to create, view and publish dashboards in Tableau Server. Users can access various data sources and build visualizations in Tableau Desktop. |
| Mobile | The dashboards from the server can be interactively visualized using mobile browsers and applications. The browser and application can be used to view and edit the contents in the workbook. |
| Web | Web browsers such as Google Chrome, Safari, Firefox and internet explorer support the Tableau server. The contents and visualizations in the dashboard can be edited through these web browsers. |
Data source Connection
Tableau can connect to various types of data sources. It can connect to text files, excel files, PDF files, etc. It can also connect to various databases using its ODBC connector. Tableau has the capability to connect to servers and web connectors.
Data Relationship
A relational Database/Excel file consists of multiple Tables/sheets. These multiple tables/sheets can be connected to each other in Tableau. This connection is established by ‘Join’ or ‘Union’ feature present in Tableau. The relationship between data in two or more tables needs to be specified while joining tables.
Joins: Tableau can “join” tables. It can join up to 32 tables in a data source. While joining, the relationship between two or more tables can be specified. The tables present in the data source can be related to each other using the joins such as inner join, left join, right join and outer join.
| Inner Join | Left Join | Right Join | Outer Join |
| It joins all the common records between two tables or sheets. The joining condition can be given based on the primary key. One or more joining conditions can be specified to join the tables. Many tables can be joined together in Tableau for visualization. | A left join is used to join all the records from a left table and common records from the right table. One or more join conditions can be specified to left join two different tables. | A right join is used to join all the records from a right table and common records from left table. Based on the requirements, one or more joining condition can be set. | An Outer join is used to join all the records from both left and right table. Joining conditions can be set to join common records. |
Data Sorting
Data present in the data source can be sorted based on the user requirement. It can be sorted using data source order, ascending, descending, ascending per table and descending per table.
Once the data is connected to Tableau, data sorting can be done using the “Sort Fields” option. The option is present in the “Data Source” tab.
Filters
Data can be organized and simplified by using various techniques in Tableau. The filters can be applied in a worksheet to restrict the number of records present in a dataset. Various types of filters are used in Tableau Desktop based on different purposes.
- Extract Filters – Extract filters are used to filter the extracted data from data source. This filter is utilized only if the user extracts the data from data source.
- Data Source Filters – A data source filter is used to filter the data in data source level. It can restrict the records present in the data set. This filter is similar to extract filter on securing the data. But data source filter and extract filter is not linked to each other. Data source filter works on both live and extracts connection.
- Context Filters – A Context filter is an independent filter that can create a separate dataset out of the original data set and compute the selections made in the worksheet. One or more categorical filter that separates the dataset into major parts can be used as a context filter. All other filters used in the worksheet works based on the selection of context filter.
- Dimension Filters – When a dimension is used to filter the data in a worksheet, it is called as Dimension filter. It is a non-aggregated filter where a dimension, group, sets and bin can be added. A dimension filter can be applied through the top or bottom conditions, wildcard match and formula.
- Measure Filters – A measure filter can filter the data based on the values present in a measure. The aggregated measure values can be used in measure filter to modify the data.
Sort Data
Data present in the visualization and worksheet can be sort based on the requirement. It can sort the data based on data source order, ascending, descending or depend on any measured value.
Groups
Group is used to combine members present in a field. For example, aggregated values of ‘Furniture’ and ‘Office Supplies’ can be obtained by using group. Once the group is built, aggregated value of ‘Furniture’ and ‘Office Supplies’ can be shown in the visuals.
Hierarchy
Hierarchies can be building in Tableau to visualize the data in granular level
Generated Fields
Tableau generates some fields which can be visible in the data pane. These fields are generated in addition to the fields present in the data set. The generated fields are given as follows.
- Measure names and Measure values – Measure names and Measure values are the two fields created in Tableau by default. These fields are created when a data set is imported into Tableau. You can go to a Data pane of the worksheet and view the fields
- Number of Records – Number of records shows the count of records present in the data set. It is an auto-generated field in Tableau which assigns a value ‘1’ for each record present in the data set.
- Longitude and Latitude – Longitude and Latitude (generated) fields are associated with the geographical detail present in the data. Dataset should consist of geographical details like City, Country or State. The longitude and latitude values are auto-generated in Tableau.
Build Charts and Visuals
Tableau can create interactive visuals for easy data interpretation. You can create various types of graphs in Tableau based on the purpose. The different charts that can be created using Tableau are
- Pareto Chart
- Bullet Chart
- Bar Chart
- Line chart
- Text Tables
- Heat Map
- Waterfall Chart
- Gantt chart
- Pie Chart
- Scatter Plot
- Area Chart
- Dual Axis Chart
- Bubble Chart
- Histogram
