The simple moving average gives the same weight to each point in moving average calculation. The problem with this it is that the more recent data points deserve a greater weighting in the formula as they are more relevant to the future price action of the instrument.
To solve this problem the exponential moving average was introduced. It gives more weight to the more recent price points in calculating the moving average line.
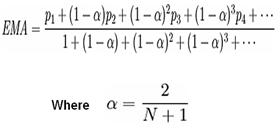
The formula to calculate the EMA is below:
Exponential Moving Average Calculation
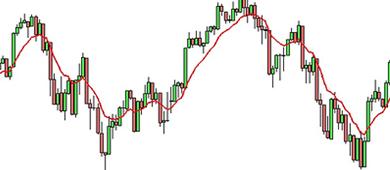
EMA displayed on a chart
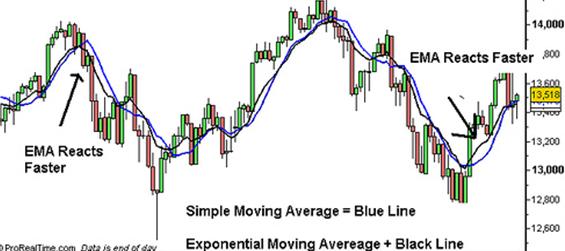
When the simple moving average and the exponential moving average are plotted together on a chart it can be observed that the exponential average reacts faster to the most recent price action.
Example Comparing EMA with SMA
Moving averages can be created from any number of trading periods however the most commonly used are the 200-day MA and the 50-day MA. Others include 15, 20, and 100-day MAs.
The choice between SMA and EMA depends on the trading style and the financial instrument that one is trading. As the simple moving average is slower to react than the EMA, traders will often use the SMA for trading longer term moves and EMAs for shorter term moves. One must study Traders how different scrips have reacted in the past using both types of moving averages and then choose the one that has best represented the types of moves they are trying to trade.
Traders use the moving average in combination with other indications, patterns and formations. There are three main ways a trader can use moving averages to trade.
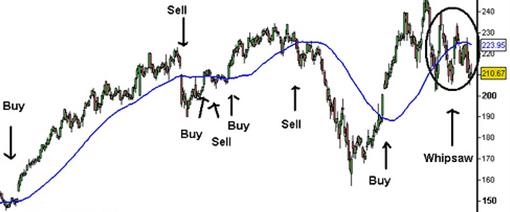
The most basic way that traders will use moving averages is to identify and then trade with the trend of a particular instrument. The trader will buy when the price of a financial instrument breaks above the moving average line and sell when the financial instrument breaks below the moving average line. For confirmation, traders need to wait for a full bar to close above the moving average line before entering long and a full bar to close below the moving average line before entering a short position.
Example of trend following using Moving Averages
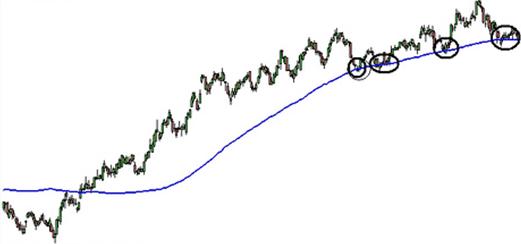
As moving averages are lagging indicators they tend to work well in identifying and following a trend and not to work well in ranging or trend less markets. Because of this traders use them to trade with the trend as well as to identify potential areas of support or resistance which may result in a continuation or reversal of a trend. Traders with the MA identify areas of support or resistance and then trade the break of these levels. When a stock has shown a particular moving average level to be significant from a support or resistance standpoint in the past by testing the moving average line several times, and then breaks that level, traders can take this as a warning sign that the trend is reversing.
Example of Trading Support and Resistance Breaks Using Moving Averages
A traders will make use of moving averages by plotting a longer term moving average and a shorter term moving average on a chart and trading the cross over. The shorter term moving average will be faster in identifying changes in the trend and therefore traders enter long when the shorter term moving average crosses above the longer term moving average. They will enter short positions when the shorter term moving average crosses below the longer term moving average.
Example of Moving Average Crossovers
Apply for Technical Analysis Certification Now!!
http://www.vskills.in/certification/Certified-Technical-Analyst
