The indicator called Moving Average Convergence Divergence is constructed by taking a 12 period exponential moving average of a financial instrument and subtracting its 26 period exponential moving average. The resulting line is plotted below the price chart and fluctuates above and below a center line which is placed at value zero. A 9 period EMA of the MACD line is normally plotted along with the MACD line and used as a signal of potential trading opportunities.
Example of what a MACD looks like on a chart
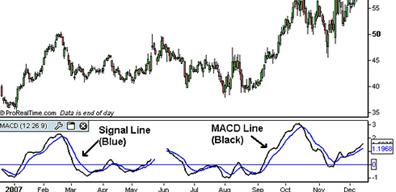
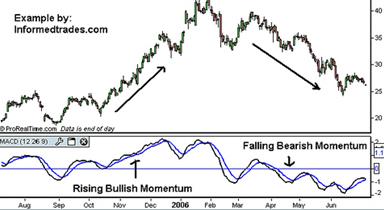
When the MACD line is above zero, it says that the 12 period EMA is trading above the 26 period exponential moving averages. When the MACD line is below zero, it means that the 12 period exponential moving average is below the 26 period EMA. When the MACD line is above zero and rising this is a sign that the positive gap between the 12 and 26 EMA’s is widening. This is a sign of increasing bullish momentum.
Conversely, when the MACD line is under zero and falling, this represents a widening in the negative gap between the 12 and 26 day EMAs. This is a sign of increasing bearish momentum.
Example of Rising and Falling MACD lines
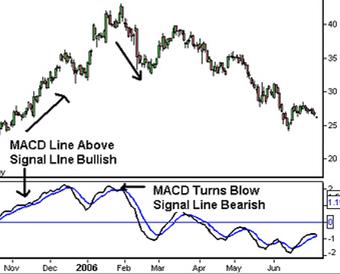
The purpose of the 9 period EMA line is to further confirm bullish changes in momentum when the MACD crosses above this line. Similarly, it is to also confirm bearish changes in momentum when the MACD crosses under this line.
Example of the Signal Line
Many charting systems that traders have plot a histogram along with the MACD which is representative of the distance between the MACD and its signal line. When the MACD histogram is above zero (the MACD line is above the signal line) this is an indication that positive momentum is increasing. Conversely when the MACD histogram is below zero this is an indication that negative momentum is increasing.
Example of the MACD histogram
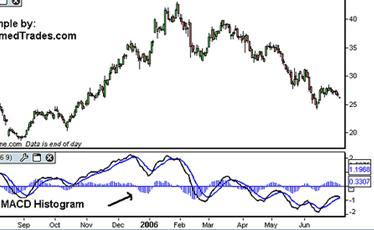
When the MACD histogram is above zero (the MACD line is above the signal line) this is an indication that positive momentum is increasing. Conversely when the MACD histogram is below zero this is an indication that negative momentum is increasing. The higher or lower the histogram goes above or below zeros the greater the momentum of the trend is thought to be.
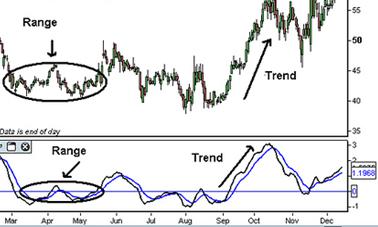
If the MACD line is at or close to the zero line, this indicates that the stock is not demonstrating strong trending characteristics, and should not be traded using the MACD.
Example of Identifying Trending and Non-Trending Markets with MACD
There are three ways that the MACD is incorporated into trading strategies.
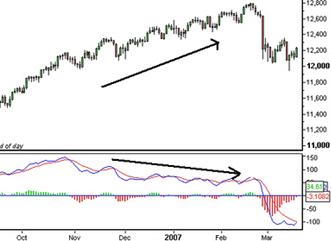
- Positive and Negative Divergence: Divergence occurs when the direction of the MACD is not moving in the same direction of the stock price. This can be seen as an indication that the upward or downward momentum in the market is failing. One should trade the reversal of the trend and consider this signal particularly strong when the market is making a new high or low and the MACD is not.
Example of MACD Negative Divergence
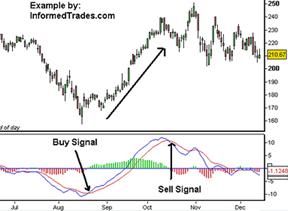
- The MACD/Signal Line Crossover: The easiest way to trade the MACD involves going long when the MACD line crosses above the signal line and going short when the MACD line crosses below the signal line. As this strategy generates the most signals, it also generates the most false signals. Therefore, to prevent bad trades, traders confirm the signals with other methods like chart patterns, volume etc.
Example of Using the MACD Crossover as Buy and Sell Signals
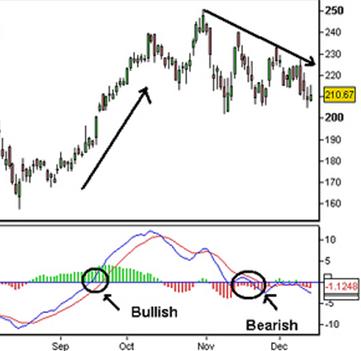
- The zero line crossovers: The MACD zero line cross over occurs when the MACD crosses above or below the line plotted at point zero on the indicator. When this occurs it is an indication that market momentum has reversed direction. The strength of the move that can be expected as a result of this depends on what has been happening in the market and what has been happening with the indicator. If the market and the MACD are both coming off of recent new highs then this could be considered a strong signal. If the market is simply trading in a weak trend or range and the MACD has simply crossed from just above to just below the zero line, then this would be considered a weak signal.
Example of a Bullish and Bearish Zero Line MACD Cross
Apply for Technical Analysis Certification Now!!
http://www.vskills.in/certification/Certified-Technical-Analyst

