Solver is the add-in, used for finding the optimum result of a given problem. The Excel spreadsheet can be used to solve a nonlinear optimization and is illustrated by an example.
Example
The production of steel uses continuous casting as an intermediate process. An optimization problem can be formulated for the production variables involved. The cast product is characterized by its dimensions, THICK (thickness), WID (width) and LEN (length). One can achieve different objectives in the production process. In this paper, we will consider maximizing the output, calculated in tons per hour (TPH).
Variables in Problem
- TPH – rate at which the cast product comes off the caster (tons/hr.)
- THICK – thickness of cast product (ins.)
- WID – width of cast product (ins.)
- LEN – length of cast product at the time it solidifies (ft.)
Objective
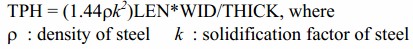
We wish to maximize the output (TPH). The equation for TPH in terms of the dimensions of the cast product is given as, with the derivative being
Constraints
- The aspect ratio, WID/THICK, is bounded above
- The thickness, THICK, must have a lower limit
- The cross-sectional area, LEN*WID, must be between prescribed lower and upper limits
- The length, LEN, is bounded above
Mathematically, the constraints can be written as follows, with the items in blue italics representing constants:
WID/THICK <= Max Aspect Ratio
Minthick <= THICK
Minarea <= WID*LEN <= Maxarea
LEN <= Lenmax
The problem can be set up in Excel as shown in the figure below.
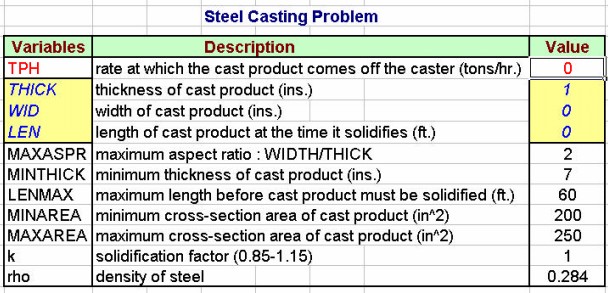
The objective and constraints are then entered. The formula for the following objective is highlighted in the figure above.
Maximize output in tons/hour TPH = (1.44*rho*k^2)*LEN*WID/THICK
given the following constraints
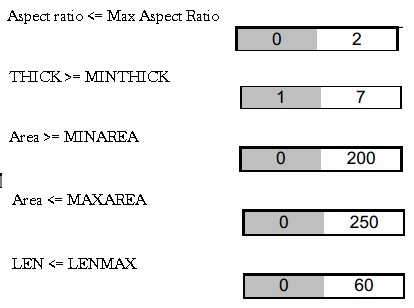
The Solver dialog box is then called up from the Tools menu bar. All constraints, variables, and constants are entered through cell references. The following figure shows the dialog box corresponding to this problem.
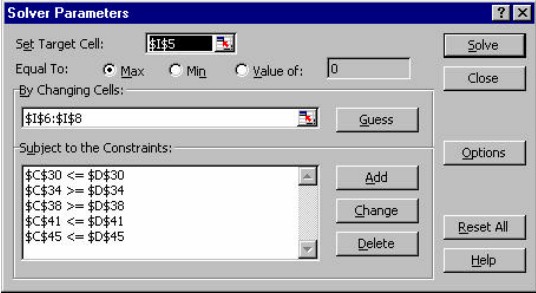
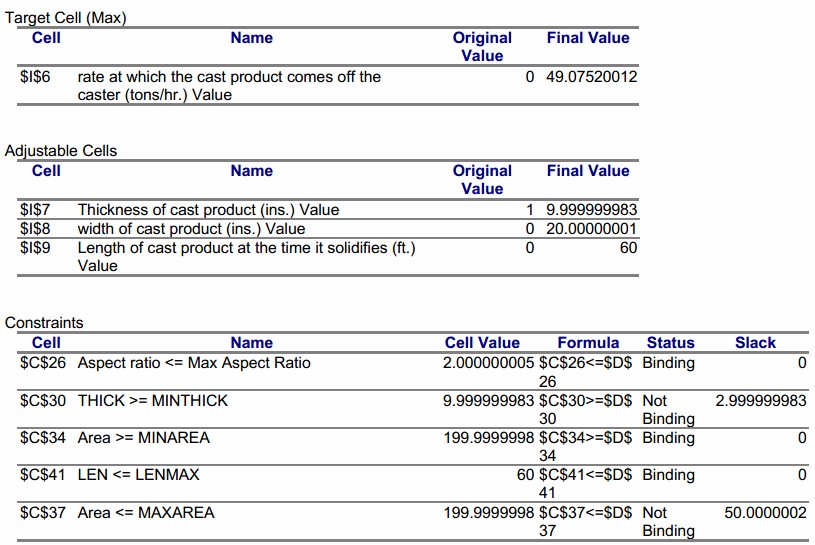
The objective function is in the target cell which is set to maximize. The other cell references are from the constraints listed in the cells. Clicking the Solve button will bring up another dialog box which will ask for a variety of options. One of these is an answer report, which is useful to generate and given in the following page.