Frequency Distributions
A frequency distribution graphically summarizes and displays the distribution of a process data set. Moreover, the shape is visualizing against how closely it resembles the bell curve shape. And, the frequency distribution’s centrality shows the degree to which the data center on a specific value and the amount of variation in range or variance from the center.
Graph
- A frequency distribution groups data into certain categories and, each category representing a subset of the total range of the data population or sample.
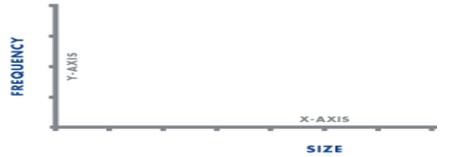
- Moreover, Frequency distributions are usually in the histogram form. And, size is shown on the horizontal axis (x-axis) and the frequency of each size is shown on the vertical axis (y-axis) as a bar graph.
- Above all, the length of the bars is proportional to the relative frequencies of the data falling into each category. And, the width is the range of the category.
Cumulative Frequency Distribution
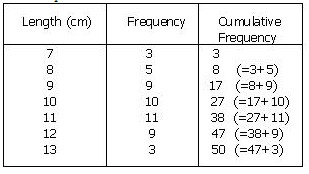
It came from a frequency distribution by adding an additional column to the table known as cumulative frequency. Thus, for each value, the cumulative frequency for that value is the frequency up to and including the frequency for that value. Moreover, it shows the number of data at or below a particular variable.
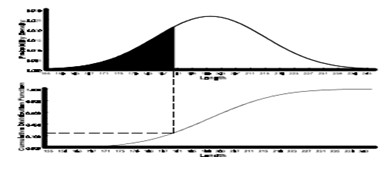
For example, see the below figure. Here, cumulative distribution function, F(x), denotes the area beneath the probability density function to the left of x.
Learn and enhance your skills in Frequency Distributions. Become a Certified TQM Professional Now!
