
Let us discuss the Statistical Process Control (SPC).
Statistical process control (SPC) is a technique for applying statistical analysis to measure, monitor, and control processes.
Objectives and Benefits
The major component of SPC is the use of control charting methods. It had been pioneered by Walter Shewhart in the 1920s and later enhanced by W. Edwards Deming, statistical process control (SPC) is a statistical method for measuring, monitoring, controlling, and improving a process. The basic rule of SPC is to leave the variations from common causes to chance but to identify and eliminate special causes. Since all processes are subject to variation, SPC relies on statistical evidence instead of on intuition.
SPC accrues various benefits like –
- Monitor processes for maintaining control
- Detect special causes
- Serve as decision-making aids
- Reduce the need for inspection
- Increase product consistency
- Improve product quality
- Decrease scrap and rework
- Increase production output
- Streamline processes
Selection of Variable
The risk of charting many parameters is that the operator will spend so much time and effort completing the charts, that the actual process becomes secondary. When a change does occur, it will most likely be overlooked. In the ideal case, one process parameter is the most critical, and is indicative of the process as a whole. Some specifications identify this as a critical to quality (CTQ) characteristic. CTQ may also be identified as a key characteristic.
Common Causes
Common causes are sources of process variation that are inherent in a process over time. A process that has only common causes operating is said to be in statistical control. A common cause is sometimes referred to as a “chance cause” or “random cause”. Examples includes variation in raw material, variation in ambient temperature and humidity, variation in electrical or pneumatic sources, variation within equipment (worn bearings) or variation in the input data.
Special Causes
Special causes or assignable causes are sources of process variation (other than inherent process variation) periodically disrupting the process. A process that has special causes operating is said to lack statistical control. Examples include tool wear, large changes in raw materials or broken equipment.
Type I SPC Error
It occurs when we treat a behavior as a special cause when no change has occurred in the process. It is also referred to as “over control”.
Type II SPC Error
Occurs when we do not treat a behavior as a special cause when in fact it is a special cause. It is also referred to as under control.
Defect
An undesirable result on a product; also known as “a nonconformity”.
Defective
An entire unit failing to meet specifications; also known as “a nonconformance”.
Rational sub-grouping
Rational sub-grouping is a subset defined by a specific factor. As a sample with variations caused by conditions producing random effects, the rational subgroup identifies and separates variations by special causes. Rational subgroups are our attempt to be sure that we are asking the right questions about the data. Selecting the appropriate control chart to use depends on the subgroups.
Sources of Variability
The long term variation in a product will, for convenience, be termed the product (or process) spread. One of the objectives of control charting is to markedly reduce the lot-to-lot variability. The distribution of products flowing from different streams may produce variability’s greater than those of individual streams. It may be necessary to analyze each stream-to-stream entity separately. Another main objective of control charting is to reduce time-to-time variation.
Selection and application of control charts
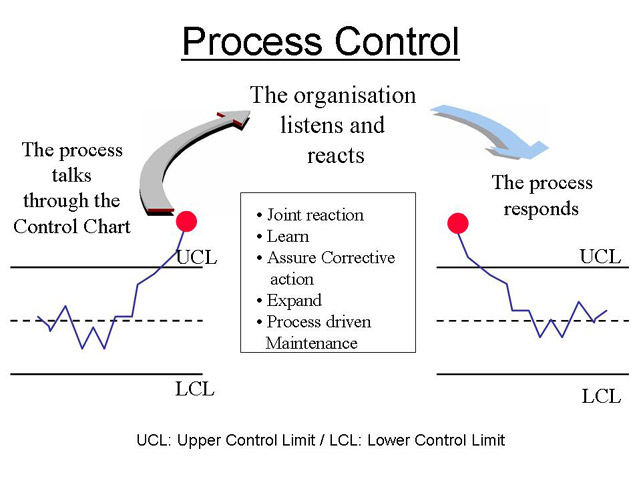
Control charts are the most powerful tools to analyze variation in most processes – either manufacturing or administrative.Control charts were originated by Walter Shewhart in 1931 with a publication called Economic Control of Quality of Manufactured Product.
Originated by Walter Shewhart, control charts are a type of graph for studying how a process changes over time. By comparing data points to a central line average, with an upper control limit (UCL) and lower control limit (LCL), users can note variation, track common causes, and seek special causes. Alternative names are “statistical process control charts” and “Shewhart charts”. Run charts display data measures over time without the central line average and the limits.
Types of control charts
Different types of control charts exist depending on the measurement used and two basic categories are
- Variable charts – It is constructed from variable data (data that consists of measurements like weight, length, etc.). Variable data contains more information than data that simply qualifies or counts something. Consequently, variable charts are some of the most powerful tools in quality improvement. In it the samples are taken in 2-10 subgroups at predetermined intervals with the statistic (mean, range, or standard deviation) calculated and recorded on the chart.
- Attribute charts – It Uses attribute data(data that counts items, such as the number of rejects or the number of errors). Control charts based on attribute data are generally less powerful and sometimes more difficult to interpret than variable charts. Samples are taken from lots of material where the number of defective units in the sample are counted (for p and np-charts) or the number of individual defects are counted for a defined unit (c and u-charts).
p-Charts
The p-chart is one of the most-used types of attribute charts. It shows the proportion of defective items in successive samples of equal or varying size. Consider the proportion as the number of defectives divided by the number in the sample. To develop the control limits for a p-chart, consider the case where we are inspecting a variable sample size and recording the number of nonconforming items in each sample.
np-Charts
The np-chart, number of defective units, is related to the p-chart. The np-chart is a control chart of the counts of nonconforming items (defectives) in successive samples of constant size. The np-chart can be used in place of the p-chart to plot the counts of non-conforming items (defectives) when there is a constant sample size. In effect, using np-charts involves converting from proportions to a plot of the actual counts.
C-Chart
The c-chart is based on Poisson distribution and work with the count of individual defects rather than numbers of defective units. It’s formula assume counting the number of defects in the same area of opportunity. The c in the formulas is the number of defects found in the defined inspection unit, and that is plotted on the chart.
U-Chart
It is also based on Poisson distribution and work with the count of individual defects rather than numbers of defective units. With a u-chart, the number of inspection units may vary. The u-chart requires an additional calculation with each sample to determine the average number of defects per inspection unit. The n in the formulas is the number of inspection units in the sample.
Analysis of control charts
Interpreting control charts is a learned behavior based upon increased process knowledge. No shortcuts exist to becoming competent at the skill of interpreting control charts and it is most certainly not a skill learned without practice. The distinction between common and special causes is critical in statistical process control. For Shewhart and Deming, this distinction is the distinction between a process surrounded by “noise” and one sending a “signal.”
Short-Run SPC
Short-run or low-volume production is common in manufacturing systems and includes manufacturing processes that produce built-to-order products or quick turnaround production. The short-run control chart can also be used in other industries such as general services and healthcare when data are collected infrequently. These processes often are so short that not enough data can be collected to construct standard control charts.
Exponentially Weighted Moving Average (EWMA)
The exponentially weighted moving average (EWMA) is a statistic for monitoring a process by averaging the data in a way that gives less and less weight to data as they are further removed in time. By the choice of a weighting factor, 8, the EWMA control procedure can be made sensitive to a small or gradual drift in the process.
CUSUM Charts
It is called as the cumulative sum control chart (CUSUM) and is used with variable data and calculates the cumulative sum of the deviations from target to detect shifts in the level of the measurement. It may be suitable when necessary to detect small process shifts faster than with a comparable Shewhart control chart.
V-mask
A V-mask resembles a sideways V. The chart is used to determine whether each plotted point falls within the boundaries of the V-mark. Points falling outside are considered to signal a shift in the process mean. Each time a point is plotted, the V-mask is shifted to the right. The geometry associated with the construction of the V-mask is based on a combination of specified and computed values. The graph below shows how the formulas relate.
Take Free Mock Test on Six Sigma Green Belt
Apply for Certification Exam !!
Certified Six Sigma Green Belt Professional