
Data collection and Data Summarizing- Process improvement needs it to be measurable by data collection which is critical for any improvisation.
Types of Data and Measurement Scales
Types of data – They are of two types, discrete and continuous.
Attribute or discrete data – It is based on counting like the number of processing errors, the count of customer complaints, etc. Discrete data values can only be non-negative integers such as 1, 2, 3, etc. and can be expressed as a proportion or percent (e.g., percent of x, percent good, percent bad). It includes
- Count or percentage – It counts of errors or % of output with errors.
- Binomial data – Data can have only one of two values like yes/no or pass/fail.
- Attribute-Nominal – The “data” are names or labels. Like in a company, Dept A, Dept B, Dept C or in a shop: Machine 1, Machine 2, Machine 3
- Attribute-Ordinal – The names or labels represent some value inherent in the object or item (so there is an order to the labels) like on performance – excellent, very good, good, fair, poor or tastes – mild, hot, very hot
Variable or continuous data – They are measured on a continuum or scale. Data values for continuous data can be any real number: 2, 3.4691, -14.21, etc. Continuous data can be recorded at many different points and are typically physical measurements like volume, length, size, width, time, temperature, cost, etc. It is more powerful than attribute as it is more precise due to decimal places which indicate accuracy levels and specificity. It is any variable measured on a continuum or scale that can be infinitely divided.
Converting Data Types – Continuous data, tend to be more precise due to decimal places but, need to be converted into discrete data. As continuous data contains more information than discrete data hence, during conversion to discrete data there is loss of information.
Measurement – A measurement is assigning numerical value to something, usually continuous elements. Measurement is a mapping from an empirical system to a selected numerical system. The four measurement scales employed are nominal, ordinal, interval, and ratio
Data collection methods
Data collection is based on crucial aspects of what to know, from whom to know and what to do with the data.
Few types of data collection methods includes —
Check sheets – It is a structured, well-prepared form for collecting and analyzing data consisting of a list of items and some indication of how often each item occurs.
Coded data– It is used when presence of too many digits are to be recorded into small blocks or during data capturing of large sequences of digits from a single observation or rounding off errors are observed whilst recording large digit numbers.
Automatic measurements – In it a computer or electronic equipment performs data gathering without human intervention like radioactive level in a nuclear reactor.
Techniques for Assuring Data Accuracy and Integrity
Data collection and Data Summarizing- Data integrity and accuracy have a crucial in the data collection process as they ensure the usefulness of data being collected. Data integrity determines whether the information being measured truly represents the desired attribute and data accuracy determines the degree to which individual or average measurements agree with an accepted standard or reference value.
Sampling – Practically all items of population cannot be measured due to cost or being impractical hence, sampling is used to get a representative group of items to measure. Various sampling strategies are
- Random Sampling – The use of a sampling plan requires randomness in sample selection and requires giving every part an equal chance of being selected for the sample. The sampling sequence must be based on an independent random plan. It is the least biased of all sampling techniques, there is no subjectivity as each member of the total population has an equal chance of being selected and can also be obtained using random number tables.
- Sequential or Systematic Sampling – Init every nth record is selected from a list of the population. Usually, these plans are ended after the number inspected has exceeded the sample size of a sampling plan. It is used for costly or destructive testing. If the list does not contain any hidden order, this strategy is just as random as random sampling.
- Stratified Sampling – It selects random samples from each group or process that is different. If the population has identifiable categories, or strata, that have a common characteristic, random sampling is used to select a sufficient number of units from each strata. Stratified sampling is often used to reduce sampling error. The resulting mix of samples can be biased if the proportion of the samples does not reflect the relative frequency of the groups.
Sample Homogeneity – It occurs when the data chosen for a sample have similar characteristics. It focuses on how similar the data are in a given sample.
Sampling Distribution of Means – If the means of all possible samples are obtained and organized, we could derive the sampling distribution of the means.
Sampling Error – The sample statistics may not always be exactly the same as their corresponding population parameters. The difference is known as the sampling error.
Graphical methods – They are effective tools for the visual evaluation of data is a graph showing the relationship between variables.
Box plot – It is also called a box-and-whisker plot or “five number summary”. It has five points of interest, which are the quartiles, the median, and the highest and lowest values and shows how the data are scattered within those ranges.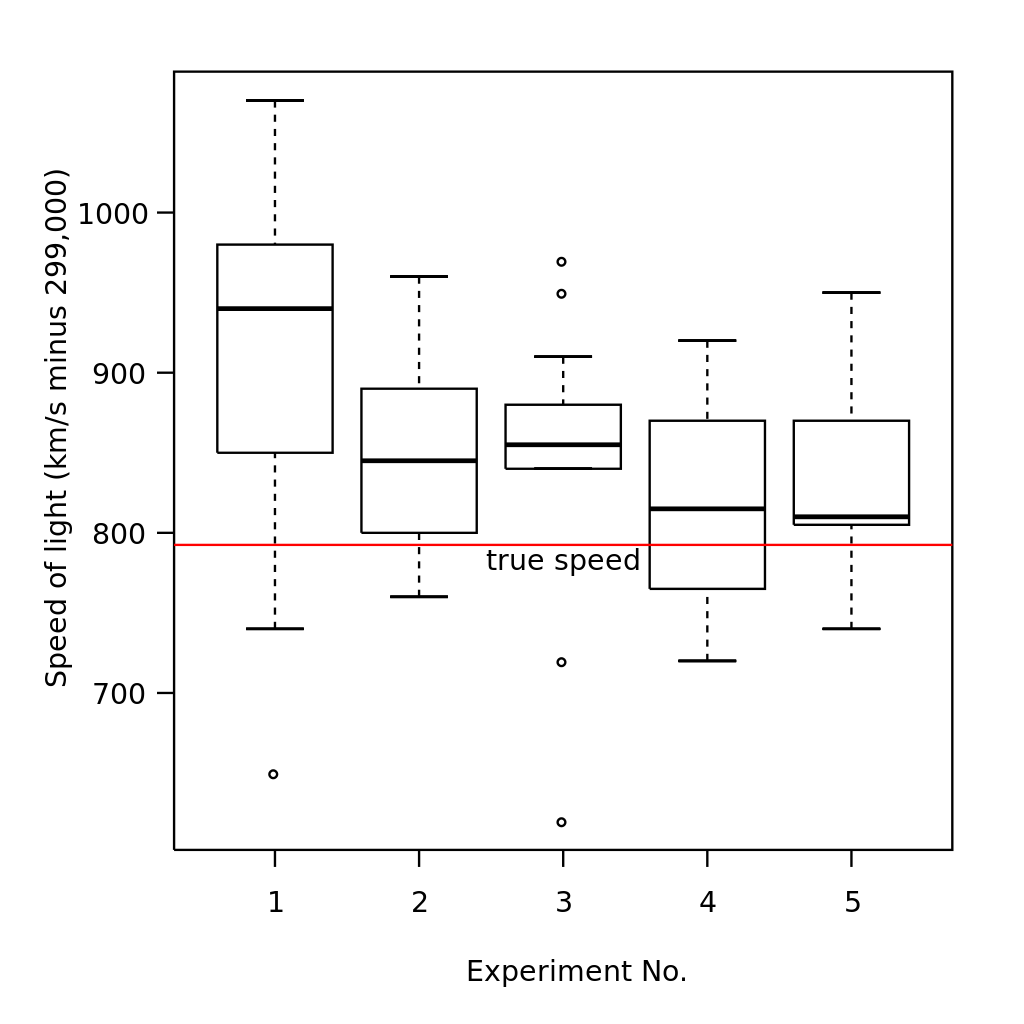
Stem and Leaf Plot – It separates each number into a stem (all numbers but the last digit) and a leaf (the last digit) like, for the numbers 45, and 59, the stems are 4 and 5, while the leaves are 5 and 9.
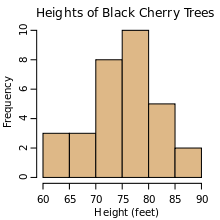
Histograms – It shows frequencies in data as adjacent rectangles, erected over intervals with an area proportional to the frequency of the observations in the interval.
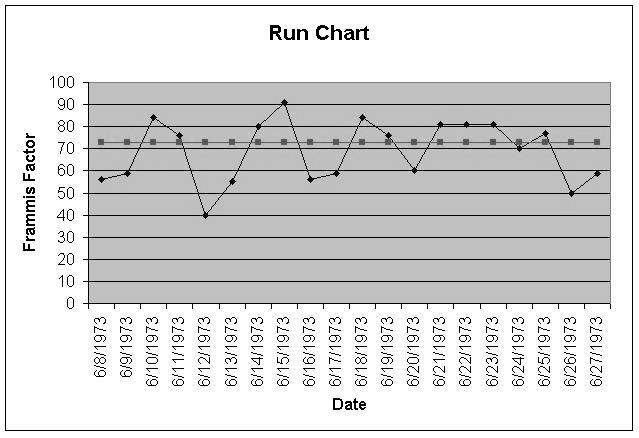
Run Charts – It displays how a process performs over time as data points are plotted in chronological order and connected as a line graph.
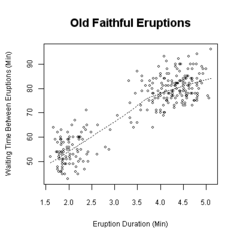
Scatter Diagram – It is displays multiple XY coordinate data points represent the relationship between two different variables on X and Y-axis.
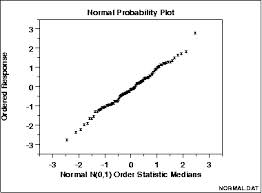
Normal Probability Plots – It is used to detect the presence of normal bell curve or Gaussian distribution in the process data.
Weibull Plots – It is usually used to estimate the cumulative probability that a given sample will fail under certain conditions.

Take Free Mock Test on Six Sigma Green Belt
Become Vskills Certified Six Green Belts Professional. Gain some knowledge on the module “Data collection and Data Summarizing”.
Apply for Certification Exam !!
Certified Six Sigma Green Belt Professional