Process Flow Metrics- In Six Sigma, you want to define a process very precisely — down to the last detail of activity, resource, decision, dependency, and value. Sometimes, this level of definition is the only way you can sufficiently measure and analyze a process, leading to breakthrough improvements and, ultimately, effective controls.
Mapping or modelling the process is a representation of this precise process definition, and the practice of process modelling is therefore fundamental to Six Sigma. A process map looks like a flowchart, and, at the top level, that’s exactly what it is. A process map is a picture of the activities and events in a process.
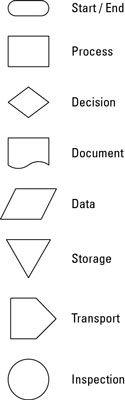
Six Sigma process mapping begins with building flowcharts. You then annotate and define the paths, encounters, decisions, and destinations on these charts in quantitative terms, including such measures as value, time, resources, yields, and the statistical distributions around each.
How to draw a Six Sigma process map?
Process mapping has been practiced for decades. The Six Sigma style of process mapping has a few different aspects, however, so you utilize a few new features from its flowchart ancestors.
- In the world of Six Sigma, you characterize the process map in mathematical terms so you can perform a plethora of statistical analyses on its various parts and pieces. You back each step, function, and activity with numerical descriptions and quantifiable attributes, enabling you to see the process in all its exacting glory.
- In Six Sigma process mapping, you characterize a practical situation in ways that let you describe it in statistical terms, allowing you to develop statistical solutions that you then apply back into your practical environment.
- As you begin, don’t worry about the details of what happens inside each of these boxes. Your goal at this stage is to capture each of the steps, identify its basic function, and connect all the steps in the manner that represents the existing process.
Define and visualize the process points
After the process map is drafted, the next step is to define each of the map’s objects. One must be precise and quantitative; the accuracy of your process model depends on it. If a process mapping technology tool is being used, the tool includes prompts for the numerous definitions and attributes at each node (step) in the map. The categories of process element definitions include the following:
- Operation cycle time of the process element, including its average time to complete, the variation in time called the standard deviation, and perhaps a distribution curve to represent all the possible completion times as well.
- Resources used in the process element, including human, capital, and natural resources. The better tools lets one identify resources by name and type and then later track their utilization during simulation.
- Value added by the process step, in the units of measure that mean the most to the organization. At a minimum, you must be able to define whether the process step is value add (VA) or non-value add (NVA).
- Costs of the resources consumed, including the costs of personnel, facilities, direct material, and sometimes even indirect costs.
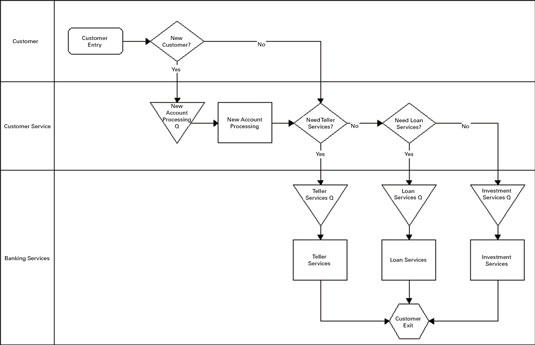
A common practice in process modeling is to employ a visualization technique called swim lanes.Processes cross functional boundaries and borders, and swim lanes helps you see that movement.
In a swim lane process map, time flows from left to right; the process crosses lanes as it traverses departments on its journey from start to finish. Imagine you’re the customer in the process map: You’re in lane 1. As you work your way through customer service and then the banking services, you cross over into lanes 2 and 3.
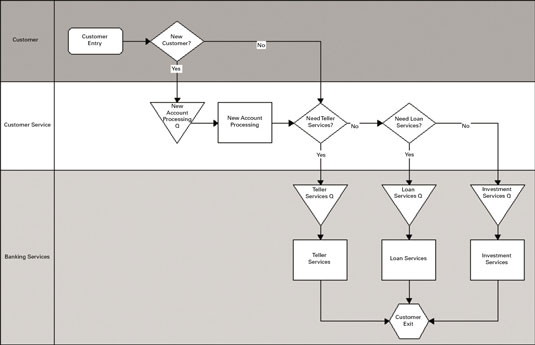
Swim lanes are an effective visualization technique that lets each functional contributor to a process understand his role while giving everyone a chance to see just how complicated the process may be within your organization. Remember, each time you cross a lane, you have in essence created a supplier-customer interaction that implies needs, wants, and desires that must be met.
Acknowledge the as-is state
Process Flow Metrics- One way to think about process mapping is as an exercise in defining a better process — how you envision your process can work sometime in the future, after implementing the changes that would enable your new concepts. It’s the to-be state of affairs. And mapping the future in this way provides you the opportunity to examine your plans in detail and consider your options before implementing the changes.
Firstly, a map of today’s reality needs to be created: the as-is state. Many organizations skip this kind of mapping. The only excuse for not modelling the as-is process is if something brand new is being implemented. Otherwise, if a process exists today, model it first. Doing so accomplishes three important tasks:
- Sets the baseline: Before you can measure the effects of your sweeping changes, you must first characterize the present conditions. By using the same process mapping techniques to characterize today’s as-is state as well as the future to-be state, you have the basis for measuring the effectiveness of your process improvement effort.
- Sees the process: Seeing the process involves recognizing that three different perspectives exist:
- What you think is going on
- What’s really going on
- What should be going on
These views are distinctly different, but characterizing the differences is precisely what you’re trying to achieve with Six Sigma. You must replace what you think is going on with what is really going on, and only then can you understand what moving to the third view requires.
- Stimulates closed-loop behaviour: Your investment in mapping primes the pump for breakthrough performance improvement. To continue the cycle of improvement, your model should be a dynamic, living entity such that your model is in sync with reality at any point in time. Modelling the as-is condition from the beginning promotes this closed-loop behaviour.
Become Vskills Certified Six Sigma Black Belt Professional. Learn the module “Process Flow Metrics”. Try the free practice test!
Apply for Six Sigma Black Belt Certification Now!!
http://www.vskills.in/certification/Certified-Six-Sigma-Black-Belt-Professional