A process is a group of resources and activities which processes inputs into outputs by value addition by executing repeatable tasks in a specific order. These activities and resource inputs at least for crucial process should be documented and controlled.
Process Modeling
Flow charts, process maps, written procedures and work instructions are tools used for process modeling and documentation.
Flow Charts
Flowcharts and process mapping are powerful tools used to depict the flow of activities in a process. These tools help show many different things including process boundaries, and responsibilities for the work to be done. These tools also show interactions between the steps, and possible disconnects. Where there are activities that are not connected to something else, it needs to be addressed. This assists in understanding and highlighting the non-value-add activities to figure out where bottlenecks are. This is helpful in distinguishing important inputs and outputs of the process.
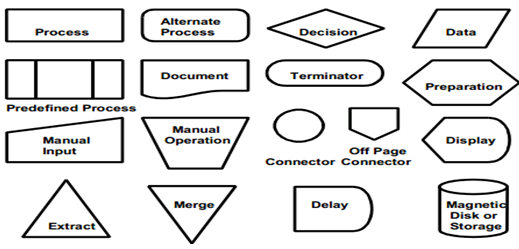
A flow chart or process map is a simple graphical tool for documenting the process flow which is comprehensible to users as it depicts the process sequence. A flow chart examines each step in detail as each task is represented by a symbol. ANSI standards are present which lists various symbol types used for representation in a flowchart. Flowchart helps in improvement identification and can compare the present process to the desired process. Diamond shaped symbol are used for decision with only two outcomes (yes or no).
Building a flowchart is very much a team sport and when you think about chartering a Lean Six Sigma kind of project, you typically want to have customers, your subject matter experts who do the work, and maybe your suppliers as well, and have a lot of people involved. The moment you want to capture is the what, the when, and the where of the entire end-to-end process.
Common flow chart symbols are
There are four steps in building a flowchart:
- Define the process boundaries ─ There are lots of ways to define the process boundaries and generally you are going to want to pick a logical start and stop point. You want to understand the steps that fall within any relatively controllable or noble process scope; where does it begin, where does it end. You want to resist the temptation to bite off more than you can chew.
- List the steps in order – Next you will want to consult those involved. These are the folks that actually know about the process and can provide inputs and suggestions, about how the process works and where you might improve it. What generally would start at a fairly high level and define the major tasks and identify the major decision points. From there you can break things down and make the connections between the steps.
- Create the flowchart with symbols.
- Verify and improve the process flow – Show the flowchart to the stakeholders, and the parties required to carry out the steps so that they can understand the process. Make the necessary changes and improvements to the process.
Process Mapping
It depicts a process in schematic format thus providing the ability to visualize the process under review. Process mapping is similar to flow charting, as it describes a process with symbols, arrows and words thus avoiding explanations. Process maps are used to outline new procedures and review old procedures for improvements. Many symbols used are standardized under ANSI Y15.3. Process maps are usually used to analyze and document top-level processes
Process mapping consists of different kinds of maps
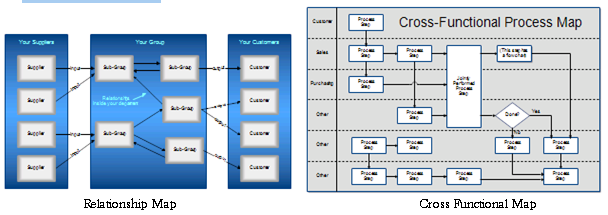
- Relationship Maps show the overall view. They show the departments of an organization and how they interact with suppliers and customers.
- Cross-functional Maps or Swim Lane Charts show which department performs each step and the inputs and outputs of each step. These maps have more detail than a relationship map but less than a flowchart.
Process maps may also contain actions which cause delays or bottlenecks – like a review or rework loop and include the following
- Workflow diagrams – Workflow diagrams support process maps and are called spaghetti diagrams in the practice of Lean. Workflow diagrams are extremely helpful determining the number of steps in a process, the degree and amount of movement involved, as well as the locations of the tasks, actors, and people working in a process. The technique is to get a two-scale drawing or blueprint of a process and pretend you’re it. Record the first thing that happens – that’s step one. Then follow the process and walk through to what or who gets it next using lines to illustrate the motion in physical space between steps in a process. Place numbers in the various relevant spaces on the floor chart, where each number represents a step. Link the steps by way of arrows which indicate the order of the steps.
- Top-down chart – A top-down chart is a valuable source of information that can be used in conjunction with a process map. You need to understand the major steps you took in your process mapping and in your workflow diagram, then get additional data to go with it. For example, a top-down chart may detail five steps of a sales process. Each step would display as a column heading and each column would contain subsequent steps of the sales process in the rows below the relevant headings.
- Functional deployment map – A functional deployment map helps you understand the potential activities and problems that you could find. Try to understand where your inputs, outputs and other actions are in the process, then do some analysis to further your understanding. For example, consider a functional deployment map that has two columns and four rows. The first column contains rows of individuals responsible for functions of a sales process – each row is referred to as a swim lane. The second column contains a flow chart. If an individual is responsible for certain steps in the sales process, the flow chart displays the steps in the swim lane for that individual. Wherever there is a handover in responsibility for a step, there is a change in direction of the flow between swim lanes.
Written Procedures
Written procedures helps in standardizing the processes thus also enabling improvement avenues for the process. Written procedures are developed by process owners or those responsible for the process. Written procedures are used for explaining complex or lengthy processes or for routine complex tasks thus, making them crucial for being consistent. Development of written procedures is needed for being comprehensible to the user.
Documenting the process in the form of a procedure facilitates consistency in the process and avoids mistakes. Written procedure describes the process at a general level whereas, written instructions are more specific.
Work Instructions
Written instructions are list or sequence of steps to be undertaken usually by the operational staff for accomplishing a specific task. These instructions are specific to a task which is usually routine. It enlists step-by-step sequence of activities. Flow charts may also be used with work instructions to show relationships of process steps. Controlled copies of work instructions are kept in the area where the activities are performed.
Process Inputs and Outputs
Before a process can be improved, it must first be measured. This is accomplished by identifying process input variables and process output variables, and documenting their relationships through cause and effect diagrams, SIPOC and other similar tools. Inputs (Xs) are causes which are independent variables which results in specific outputs (Ys) or effects which are dependent variables. Thus, process maps are expanded to cover customer and supplier by SIPOC to gather measurable data from all.
Before you begin to make changes to a Lean Six Sigma project, it is important to understand the process and its importance. You need to understand the cause and effect of the various process steps, and recognize how everything is affected. Business processes are typically a series of events that produce a given output, and more often than not are defined by numerous steps in the end-to-end process.
Inputs
It’s important that your team clearly understands the relationship between the inputs, the process, and the outputs. Inside the process you have many X factors that together end up dictating the amount of variability, the quality, and the repeatability of your output Y factor. The variables on the outputs can be many things including, for example, context and response time, the order to delivery time for a custom bicycle, a loan approval cycle, or a visit to the doctor. You need to recognize that outputs for any end-to-end process can in turn become inputs to a subsequent or downstream process later on.
Process Boundaries
Process boundaries and dictating what those are is an important aspect of defining the project and where you are going to focus your efforts. There are transition points between each of the steps. You need to understand where you transition from one functional process to another. For example, with a manufacturing company, you could have process boundaries starting with ordering an aircraft part. And that could begin with the receipt of the order at the company and then we would have the various operations that would occur down to the inspection of that part, pass/fail. And if it’s good, you can ship it to the customer. If it fails, you’d rework it and pass it back through.
Process swim lane diagrams
Process swim lane diagrams are a powerful way to visualize and understand a complex process. The swim lane diagram is a process flow diagram that helps you understand and break down the various actors, actions, and flow of time for a process. There are a number of actors that are represented in this type of diagram. Each of these actors performs various actions. These actions are connected to other actions further down the process, until the process is finally complete.
Cause and Effect (Fishbone) Diagrams
They are also called as Ishikawa diagrams and have been discussed earlier. They break problems down into small-size pieces and displays possible causes in a graphical manner. They display how various causes interact with each other and uses brainstorming rules when generating ideas. A fishbone diagram development consists of brainstorming, prioritizing and development of an action plan.
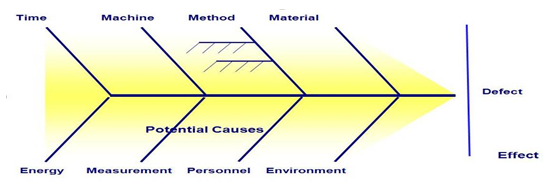
It highlights potential causes of a particular problem or the effect. During measure phase, it is used to brainstorm potential x data. The selected CTQ or CTP are placed in the head of the fish. Each bone is labeled with categories which usually are people, machine, materials, environment and methods. Each category is reviewed by the team by brainstorming for input and process data to collect. The development of fishbone diagram in measure phase involves, review of process maps developed in define phase, review of categories, putting CTQ or CTP in the head of the fish, brainstorming and reviewing the diagram with revision as needed.
SIPOC
SIPOC stands for Suppliers-Inputs-Process-Outputs-Customers and has been discussed earlier. SIPOC addresses issues regarding the input, output, supplier and customers like output being produced by the process, who provide inputs to this process, what are the inputs, what resources does this process use, which steps add value, etc. These issues apply to all processes and SIPOC addresses by putting in place a standard format.
SIPOC development is initiated with persons having knowledge of the process and then conducting a brainstorming session to describe the problems and garner consensus for resolution.
Example
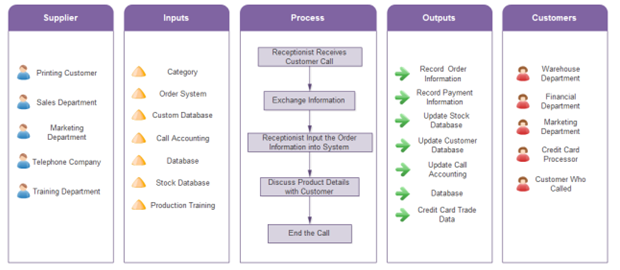
A catalogue retail company call center use this SIPOC diagram to define the scope of the process, including: the start and end of the process, the major steps, the primary inputs and outputs, and the key customers and suppliers. With this simple yet comprehensive picture at hand, every staff or member involved in this activity will have a deep and clear understanding of this process.
As it’s a high-level picture, it won’t include many details. The major steps on process part will be limited to less than 7. Usually a flowchart with arrow connectors showing the sequence can best present the steps. In this example, five steps are used to illustrate the main procedure.
Development of SIPOC involves identifying the process steps then, identifying the outputs of the process followed by the customers receiving the outputs of the process, then the inputs and the supplies of the required inputs.
SIPOC Elements
It’s important to recognize the different factors as you work through the SIPOC diagramming process. These can be captured as a spreadsheet or a flipchart. For many service processes, the customer actually makes a request as an input to your process, so they are in essence a supplier. Then you do a value-add activity, give the customer the output, and they receive it in the end.
Inputs can be raw materials, instructions, data, drawings, specifications, quality requirements, standard operating procedures, labor, resources, machines, and equipment used throughout the entire process. The process itself can take a variety of forms such as a value stream map, a process map, or a swim lane chart. You need to recognize that outputs, or Y values, that you’re trying to accomplish are products of the various actions that take place during the process. The function of the X factors in the process is to give you the quality of the output that you’re looking for at the end of the process.
An output can take many forms, such as a value-add task completion that’s ready for the downstream step, a report, a product, a part, or an assembly. It could be a new specification you’re going to use, a certification that your customer requires, a check to send to the customer, or an approval or a permit that you’re issuing.
The last element is the customer. The customer defines the key features and functions, what is appealing, and the top issues. You use that information to seek out root cause analysis and work upstream to make sure your process is delivering optimal results.
Relational Matrices
It is a relational matrix which is used to assess the effect of each input (X) against its output (Y) in a process. It helps team to identify and agree upon outputs critical to the product and/or customer with level of importance also assigned to each output variable by a numerical rating. It also highlights the relationship between inputs and outputs (Y=f(x)) and the relative importance of inputs is also computed.
The procedure of development of relational matrices is to review the process map, list the output variables (Ys) along the horizontal axis, rate each output in terms of its overall importance (like a scale of 1 for low importance to 5 for high importance), identify potential inputs (Xs) which influence the outputs (Ys), rate the effect of each X on each Y, the customer importance rating (Y) is taken as a weighted response (which is multiplied by the association rating (X) for each relationship) and the weighted ratings are then added together to compute the importance score. After which prioritizing is done to focus on specific parts.
For example, in a contact center, KPOVs might be the speed of handling the call, customer satisfaction you’re getting out of the call, and the percentage right – meaning how many times you’re actually solving the issue correctly on the first try. KPIVs might be who the technicians are, how well they’re trained, and their ability to do the job. They could also include the knowledge-based search used to solve the problem.
It can be created as
- Insert input variables in the first column. These are the x inputs to the process, such as what the materials, operators, tools, methods, machines, and equipment are.
- Insert output variables in the first row. These are the y’s you’re looking for in the back end, for example the weight of the item, the color, the size, and the quality of the product or process.
- Assign a weight to each output variable. This is a priority score for each of those y outputs in the matrix.
- Assign a weight to the effect each input has on the output. The assigned weights refer to the effect that each of the x factor inputs has on the output. For example, in an injection molding process, it might be the temperature of the barrel, the speed that the barrel turns, or the pressure you’re pushing the plastic material through into the mold.
- Multiply output weight by effect weight. This results in a calculated value, which you can then enter into the table.
- Enter values in the table and total the results. This way you can identify the most important x input factors, which are likely to be the true root causes for the problems you’re seeing in the process.
Force Field Analysis
The idea behind Force Field Analysis is that situations are maintained by an equilibrium between forces that drive change and others that resist change, as shown in Figure 1, below. For change to happen, the driving forces must be strengthened or the resisting forces weakened. It is developed as
- Step 1: Describe Your Plan or Proposal for Change – Define your goal or vision for change, and write it down in a box in the middle of the page.
- Step 2: Identify Forces For Change – Think about the kinds of forces that are driving change. These can be internal and external.
- Step 3: Identify Forces Against Change – Now brainstorm the forces that resist or are unfavorable to change.
- Step 4: Assign Scores – Next, score each force, from, say, one (weak) to five (strong), according to the degree of influence each one has on the plan, and then add up the scores for each side (for and against).
- Step 5: Analyze and Apply – Now that you’ve done your Force Field Analysis, you can use by deciding whether or not to move forward with the decision or change or think about which supportive forces you can strengthen and which opposing or resisting forces you can weaken, and how to make the change more successful.
Process Documentation
A new project team forms to solve a business problem and asks the simple question, “What is the current process?” A little digging around yields a dusty old process document, but it is so out-of-date. The project team (in their element) run a brown paper process mapping to get the true current process.
A process document outlines the steps necessary to complete a task or process. It is an internal, ongoing documentation of the process while it is occurring—documentation cares more about the “how” of implementation than the “what” of process impact. A business is essentially a group of interrelated processes, and if these processes aren’t in writing, breakdowns can occur. Companies have repeatable processes fundamental to their successful operation, thus process documentation serves as a crucial guide for employees and managers to reference.
Process documentation is about keeping track of a process during the execution of a project. The goal is to learn from the implementation so you can adjust the strategy and improve the procedure.
Proactively managing processes can:
- Eliminate flaws
- Reduce time spent on tasks
- Decrease costs
- Decrease resources associated with tasks
- Improve efficiency
- Improve overall quality
- Increase customer and employee satisfaction
Tools for process documentation
- Tools for capturing the process, such as interviews, group discussions, videos, photographs, observations of users, field diaries, etc. It can be very helpful to interview those who are experts on the process to ensure you cover all information.
- Tools for organizing information. You can summarize knowledge in articles, case studies, video bites, etc.
- Tools for visualizing processes, such as Lucidchart’s process documentation software.
- Tools for distributing information, such as email, newspapers, internet, etc.
Steps to make a process document
- Determine the scope of the document and identify your process. Will it cover one task in a chain of operations or the entire procedure for a manufacturing plant? It is best to have each document cover as small a process as possible.
- Consider the audience for whom you are writing. What do they already know about the subject? Where and how are they using the product? What are their demographics?
- Write a title and introduction describing what the process is, why or when users need to do it and how it fits into the big picture of the organization. Provide context as to why the process is important.
- Describe the individuals who will be involved in the process and define their roles. Be sure to use job titles rather than individual names.
- Identify the process boundaries, or start and end points.
- Determine the outputs of the process, or what is being produced.
- Determine the inputs of the process, or the resources needed to perform the process.
- Brainstorm all the activities needed to complete the process. This pre-writing strategy is called “listing.”
- Organize the items from your listing into sequential steps. Be careful how you split up steps. Actions that logically go together should be kept together. Generally, if a step includes more than one verb or the word “and,” it should likely be broken into two steps. Limit the number of steps—use subheadings for longer tasks and restart numbering under each subheading. Use layers—give users additional information in less prominent text underneath the main step.
- Expand your steps to ensure all necessary information is included, such as potential hazards, troubleshooting advice or examples.
- Construct a process flowchart to visually represent the steps.
- Add any screenshots or graphics that provide clarity.
- Format your information so that it is easy to scan, read and understand. Make use of bullets, tables, headings, etc. Clearly point out how processes connect to each other. For example, at the bottom of the Arranging the Newsletter document, direct readers to the Editing the Newsletter document.
- Test the process. Watch someone else use it.
- Ask colleagues to review your document and provide feedback.
- Remember your documentation is a living document and will need to be continually updated.
