The Oxford dictionary focuses on the term engagement in reference to marital relations and in this context its meaning is closer to “commitment rather than control” (I sure hope so!). But be that as it may, that definition is only a part of what engagement is.
A sufficiently encompassing technical definition from an organizational psychology perspective is generally accepted as:
Quantifying human involvement towards defined objectives”. Within the scope of this definition, a host of influencing factors could be identified, provided the objectives are well defined in the first place and involvement can be quantified.
Research has shown employees who identified themselves as happy in their positions are productive 80 percent of the time at work. Comparatively, employees who identified themselves as unhappy were only productive 40 percent of the time.
Employee Survey for Employee Engagement Index
You survey all employees to determine the Level of Engagement—using a handful of questions. Level of Engagement items tend to measure either the condition of engagement (the presence of cognitive, emotional and physical energy) and the outcomes of engagement like intending to stay with the company (retention), advocacy, and putting forth extra effort to make the organization successful.
Then, you concentrate on the Drivers of Engagement—a more extensive list of questions. You may also include items on the pre-engagement Threshold Motivators—pay and benefits.
One way to calculate an employee engagement index is to compute three numbers: the percent engaged, the percent responsive to engagement, and the percent disengaged. These numbers can be computed this way:
- Engaged: percent who give top two box responses to the Level of Engagement questions–see the numbers in yellow in the image below
- All positive responses–Strongly Agree and/or Agree
- No Neutral response
- No negative responses–Disagree and/or Strongly Disagree
- Responsive to Engagement (Passive): percent of employees who give top three box responses to the Level of Engagement questions (includes at least one Neutral response but no negative responses)
- Disengaged: percent of employees who give at least one bottom two box response to the Level of Engagement questions (includes at least one negative response–Disagree and/or Strongly Disagree)
Estimating Employee Engagement
Maslow’s hierarchy of needs is an interesting starting point. Many of us are familiar with this through our business management courses. This time-tested theory of “human psychology” provides key insights for understanding human behavior in the workplace.
All the five aspects of the pyramid manifest in some form within the course of the professional career and specific needs of employees and their own workplace.
Interestingly these aspects could even manifest differently for star performers, senior level employees or specific personality types. Individuals might have different priorities, perceived status quo and rate the same aspects in the engagement survey differently. It’s useful to identify and study these subgroups.
The traditional approach has been to accumulate survey data on factors estimated to influence employee engagement levels and then calculate metrics/ ratios for evaluation of engagement health. Any hypothesis for improvement initiatives is based on variance (differing survey ratings) between different individuals and/or same individuals at different periods.
Key interest survey points have been traditionally centered around individual goals, personal space, work life balance, clarity of mandate, transparent assessments and judgments, channels of communication, compensation and benefits, career path, work recognition, etc.
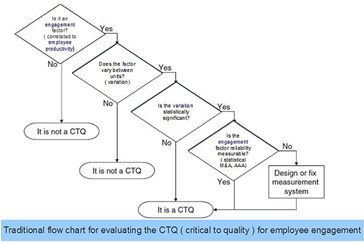
The statistical significance of a process characteristic or component is evaluated on employee engagement (in this case) and measured for acceptable quality. Identification of specific, measurable critical to quality (CTQ) characteristics is essential for meaningful and measurable improvement in employee engagement.
This is the traditional flowchart to determine the CTQ for employee engagement:
Important Considerations
- Does HR have a hunch of many hidden subgroups of employees within the organization (different scoring patterns in the engagement survey)? – Discriminant Analysis
- HR needs to know the engagement survey factors that correlate with each other and with “employee productivity” or even a third explanatory factor – Deep insights required, like Factor analysis & Principal component analysis
- HR needs to check variance (variability) of identified factors in order to find its relevance or compare same surveys conducted at different times – ANOVA/MANOVA/T-Test/paired t-Test to the rescue
- Based on findings HR needs to progressively field-test new ideas in employee engagement and predict its impact – DOE (factorial Design of Experiments) & period review via ordinal logistic regression
- HR needs to tap deep insights into the employee mindset – open text descriptive answer-based questions and insights via deep Natural Language Processing (NLP). When done right, this can deliver a lot of value.
- Innovation – design creative ratios (an HR Statistical analyst can get really creative here!), metrics and employee engagement, gamification of the workplace
