When a sample is selected from a population, it is usually because you hope it will provide information about the population. For example, you might want to use sample data to learn about the value of a population characteristic such as the proportion of students enrolled at a college who purchase textbooks online or the mean number of hours that students at the college spend studying each week. This chapter considers how sample data can be used to estimate the value of a population proportion.
An estimate of a population parameter may be expressed in two ways
- Point estimate. A point estimate of a population parameter is a single value of a statistic. For example, the sample mean is a point estimate of the population mean μ. Similarly, the sample proportion p is a point estimate of the population proportion P.
- Interval estimate. An interval estimate is defined by two numbers, between which a population parameter is said to lie. For example, a < < b is an interval estimate of the population mean μ. It indicates that the population mean is greater than a but less than b.
Estimator Selection
The first step in estimating a population characteristic, such as a population proportion or a population mean, is to select an appropriate sample statistic. When the goal is to estimate a population proportion, p, the usual choice is the sample proportion . But what makes a reasonable choice? More generally, what makes any particular statistic a good choice for estimating a population characteristic?
Because of sampling variability, the value of any statistic you might choose as a potential estimator will vary from one random sample to another. Taking this variability into account, two questions are of interest
- Will the statistic consistently tend to overestimate or to underestimate the value of the population characteristic?
- Will the statistic tend to produce values that are close to the actual value of the population characteristic?
A statistic that does not consistently tend to underestimate or to overestimate the value of a population characteristic is said to be an unbiased estimator of that characteristic. Ideally, you would choose a statistic that is unbiased or for which the bias is small (meaning, for example, that if there is a tendency for the statistic to underestimate, the underestimation tends to be small). You can tell if this is the case by looking at the statistic’s sampling distribution. If the sampling distribution is centered at the actual value of the population characteristic, then the statistic is unbiased.
The sampling distribution of a statistic also has a standard deviation, which describes how much the values of the statistic vary from sample to sample. If a sampling distribution is centered very close to the actual value of the population characteristic, a small standard deviation ensures that values of the statistic will cluster tightly around the actual value of the population characteristic. This means that the value of the statistic will tend to be close to the actual value. Because the standard deviation of a sampling distribution is so important in evaluating the accuracy of an estimate, it is given a special name: the standard error of the statistic. For example, the standard error of the sample proportion is
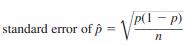
where p is the value of the population proportion and n is the sample size.
A statistic with a sampling distribution that is centered at the actual value of a population characteristic is an unbiased estimator of that population characteristic. In other words, a statistic is unbiased if the mean of its sampling distribution is equal to the actual value of the population characteristic. The standard deviation of the sampling distribution of a statistic is called the standard error of the statistic.
Feature of a statistic to be a good estimator of a population characteristic
- Unbiased (or nearly unbiased)
- Small standard error
A statistic that is unbiased and has a small standard error is likely to result in an estimate that is close to the actual value of the population characteristic.
The sampling distribution of a statistic provides information about the accuracy of estimation. Figure displays the sampling distributions of three different statistics. The value of the population characteristic, which is labeled population value in the figure, is marked on the measurement axis.
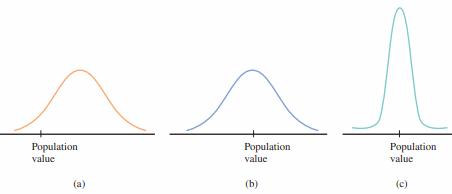
The sampling distribution in Figure (a) is from a statistic that is not likely to result in an estimate close to the population value. The distribution is centered to the right of the population value, making it very likely that an estimate (the value of the statistic for a particular sample) will be larger than the population value. This statistic is not unbiased and will consistently tend to overestimate the population value.
The sampling distribution in Figure (b) is centered at the population value. Although one estimate may be smaller than the population value and another may be larger, with this statistic there will be no long-run tendency to over- or underestimate the population value. However, even though the statistic is unbiased, the sampling distribution spreads out quite a bit around the population value. Because of this, some estimates will be far above or far below the population value.
The mean value of the statistic with the distribution shown in Figure (c) is also equal to the population value, implying no systematic tendency to over- or underestimate. The narrow shape of the distribution curve implies that the statistic’s standard error (standard deviation) is relatively small. Estimates based on this statistic will almost always be quite close to the population value—certainly more often than estimates from the sampling distribution shown in Figure (b). This statistic has the characteristics of a good estimator—it is unbiased and has a small standard error.
For populations where p is close to 0 or to 1, it is fairly easy to get a good estimate of the population proportion, because most samples will tend to produce similar results. The case where there will be the most sample-to-sample variability is where the population is most diverse. For a categorical variable with just two possible values, this is where p=0.5 (half of the population possesses the characteristic of interest and half does not). Here, the values of will vary more from sample to sample.
Estimation Error
There are two basic sources of errors that can occur when you sample randomly from a population – sampling error and non-sampling error.
Sampling error results from “unlucky” samples. As such, the term error is somewhat misleading. It is the inevitable result of basing an inference on a random sample rather than on the entire population.
Non-sampling error occurs due to
- Non-response bias. This occurs when a portion of the sample fails to respond to the survey. If the non-respondents would have responded similarly to the respondents, you don’t lose much by not hearing from them. However, because the non-respondents don’t respond, you typically have no way of knowing whether they differ in some important respect from the respondents.
- Non-truthful responses – This is particularly a problem when there are sensitive questions in a questionnaire.
- measurement error. This occurs when the responses to the questions do not reflect what the investigator had in mind. It might result from poorly worded questions, questions the respondents don’t fully understand, questions that require the respondents to supply information they don’t have, and so on.
- voluntary response bias. This occurs when the subset of people who respond to a survey differ in some important respect from all potential respondents.
