Just as the distribution of a numerical variable describes its long-run behavior, the sampling distribution of mean provides information about the long-run behavior of mean when sample after sample is selected.
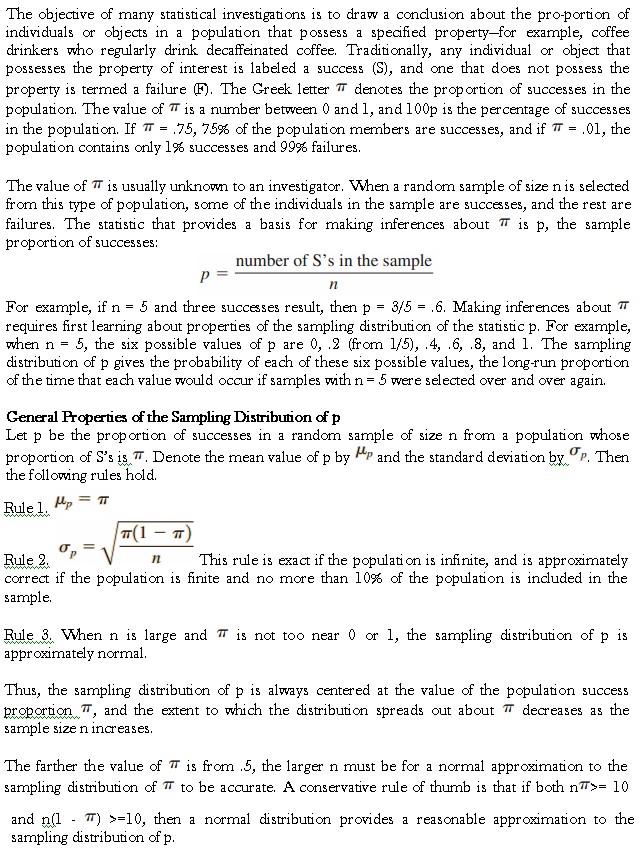
The sampling distribution of a sample proportion, p, provides information about the long-run behavior of the sample proportion that is necessary for making inferences about a population proportion.
The distribution that would be formed by considering the value of a sample statistic for every possible different sample of a given size from a population is called its sampling distribution.
Sampling Variability
Any quantity computed from values in a sample is called a statistic. The observed value of a statistic depends on the particular sample selected from the population; typically, it varies from sample to sample. This variability is called sampling variability.
Values of statistics such as the sample mean, the sample median, the sample standard deviation or the proportion of individuals in a sample that possess a particular property p, are primary sources of information about various population characteristics.
The usual way to obtain information regarding the value of a population characteristic is by selecting a sample from the population. For example, to gain insight about the mean credit card balance for students at a particular university, we might select a sample of 50 students at the university. Each student would be asked about his or her credit card balance to yield a value of x being the current balance. We could construct a histogram of the 50 sample x values, and we could view this histogram as a rough approximation of the population distribution of x.
In a similar way, we could view the sample mean (the mean of a sample of n values) as an approximation of m, the mean of the population distribution. It would be nice if the value of were equal to the value of the population mean m, but this would be an unusual occurrence. Moreover, not only will the value of for a particular sample from a population usually differ from m, but also the values from different samples typically differ from one another. (For example, two different samples of 50 student credit card balances will usually result in different values.) This sample-to-sample variability makes it challenging to generalize from a sample to the population from which it was selected.
The sampling distribution of a statistic, such as mean, provides important information about variation in the values of the statistic and how this variation relates to the values of various population characteristics. For more realistic situations with larger population and sample sizes, the situation becomes even worse because there are so many possible samples that must be considered. The sampling distributions for some statistics enables, without actually having to look at all possible samples.
Sampling Distribution of a Sample Mean
When the objective of a statistical investigation is to make an inference about the population mean m, it is natural to consider the sample mean as an estimate of m. Sampling variability causes the sample mean to vary in value from one sample to another. The behavior of sample mean is described by its sampling distribution. The sample size n and characteristics of the population—its shape, mean value m, and standard deviation s—are important in determining properties of the sampling distribution of sample mean.
For any n, the center of the sample mean distribution (the mean value of sample mean) coincides with the mean of the population being sampled and that the spread of the sample mean distribution decreases as n increases, indicating that the standard deviation of sample mean, is smaller for large n than for small n.
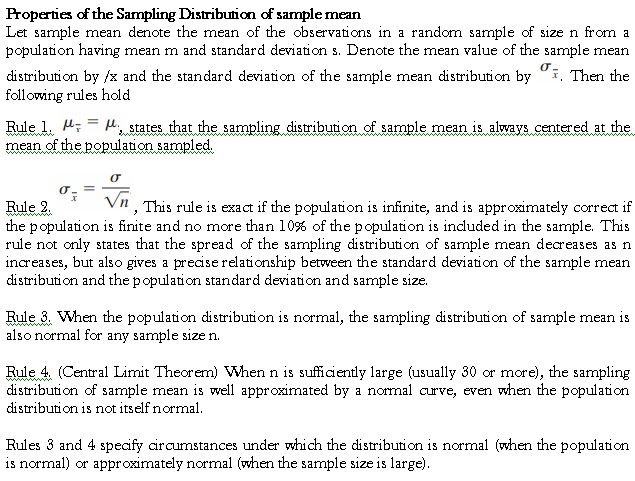
The Central Limit Theorem of Rule 4 states that when n is sufficiently large, the sample mean distribution is approximately normal, no matter what the population distribution looks like. This result has enabled statisticians to develop procedures for making inferences about a population mean m using a large sample, even when the shape of the population distribution is unknown. Application of the Central Limit Theorem in specific situations requires a rule of thumb for deciding whether n is indeed sufficiently large.
Example
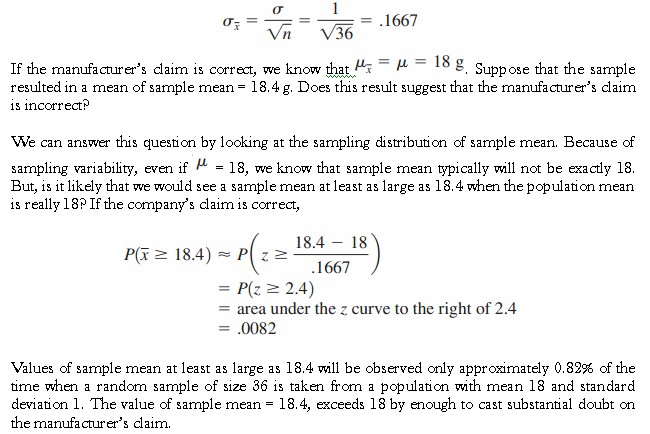
A hot dog manufacturer asserts that one of its brands of hot dogs has an average fat content of = 18 g per hot dog. Consumers of this brand would probably not be disturbed if the mean is less than 18 but would be unhappy if it exceeds 18. Let x denote the fat content of a randomly selected hot dog, and suppose that , the standard deviation of the x distribution, is 1.
An independent testing organization is asked to analyze a random sample of 36 hot dogs. Let sample mean be the average fat content for this sample. The sample size, n = 36, is large enough to rely on the Central Limit Theorem and to regard the sample mean distribution as approximately normal. The standard deviation of the sample mean distribution is
Remarks
We clarified about the sampling distribution of sample mean in two cases: for a normal population distribution and for a large sample size. But, if the population distribution is not normal and n is small then, there is no general result about the shape of the distribution. When the objective is to make an inference about the center of such a population, one way to proceed is to replace the normality assumption with some other assumption about the shape of the distribution. Theoretical methods or simulation can be used to describe the sample mean distribution corresponding to the assumed model. An alternative strategy is to create a data set that more closely resembles a sample from a normal population and then to base inferences on the transformed data. Yet another path is to use an inferential procedure based on a statistic other than sample mean.
Sampling Distribution of a Sample Proportion