Bollinger Bands are comprised of three bands which are referred to as the upper band, the lower band, and the center band. The middle band is a simple moving average which is normally set at 20 periods, and the upper band and lower band represent chart points that are two standard deviations away from that moving average.
Example of Bollinger Bands
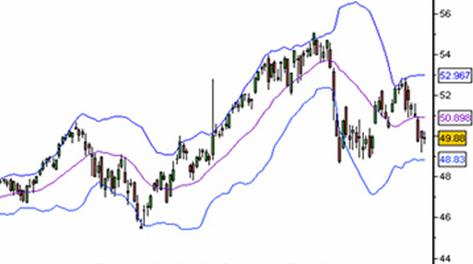
Bollinger bands provide a good tool to gauge the level of the volatility is in the market and how high or low prices are relative to the recent past. The basic premise of Bollinger bands is that price should normally fall within two standard deviations (upper and lower band) of the mean which is the center line moving average. As this is the case, trend reversals often occur near the upper and lower bands. As the center line is a moving average which represents the trend in the market, it will also frequently act as support or resistance.
The Bollinger Band is used by traders in 3 different ways.
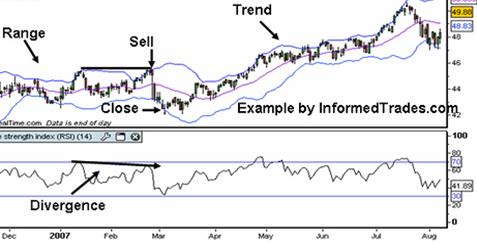
- The Bollinger bands indicator identifies potential overbought and oversold places in the market. Although some traders will take a close outside the upper or lower bands as buy and sell signals, it is recommended that this method be traded only with the confirmation of other indicators. Outside of the fact that most traders would recommend confirming signals with more than one method, with Bollinger bands prices which stay outside or remain close to the upper or lower band can indicate a strong trend, a situation that you do not want to be trading reversals in. For this reason selling at the upper band and buying at the lower is a technique that is best served in range bound markets.
Example of Buying and Selling at the Upper and Lower Band
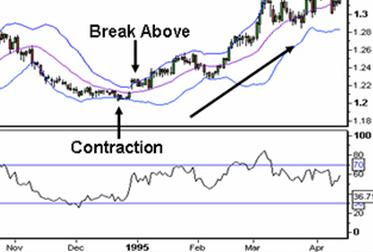
Large breakouts often occur after periods of low volatility when the bands contract. That is why traders often position themselves for a trend trade on a break of the upper or lower Bollinger band after a period of contraction or low volatility.
Example of the Bollinger Band Contraction
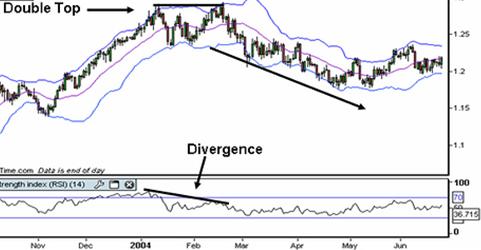
As Bollinger bands give a good picture directly about the price chart of how high or low price is relative to historical prices, this is a good indicator to use in conjunction with other methods and indicators.
Bollinger Bands with Multiple Confirmations
Apply for Technical Analysis Certification Now!!
http://www.vskills.in/certification/Certified-Technical-Analyst
