Average directional Index (ADX), an indicator that helps traders determine when the market is trending, how strong or weak a trend is, and when a trend may be about to start or reverse.
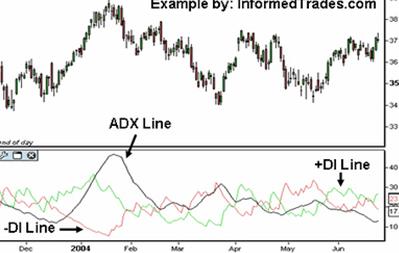
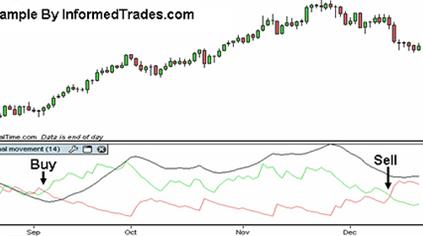
Example of the Average Directional Index (ADX)
The formula for the indicator consists of three elements.
- The +DI Line is representative of how strong or weak the uptrend in the market is.
- The –DI line is representative of how strong or weak the downtrend in the market is.
- As the ADX line is comprised of both the +DI Line and the –DI Line, it does not indicate whether the trend is up or down, but simply the strength of the overall trend in the market
As the ADX Line is Non Directional, it does not tell whether the market is in an uptrend or a downtrend but simply how strong or weak the trend in the financial instrument. When the ADX line is above 40 and rising this is indicative of a strong trend, and when the ADX line is below 20 and falling this is indicative of a ranging market.
The ADX can be used in 3 ways.
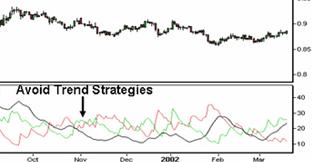
- Traders will use the ADX in their trading as a confirmation of whether or not a financial instrument is trending, and to avoid choppy periods in the market where many find it harder to make money. In addition to a situation where the ADX line trending below 20, the developer of the indicator recommends not trading a trend based strategy when the ADX line is below both the +DI Line and the –DI Line.
Example
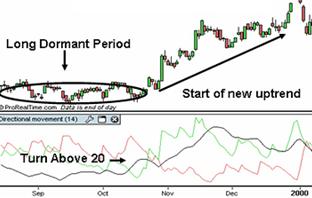
- A second way that traders use this indicator is to identify the potential start of a new trend in the market. They will look from below the 20 line to above the 20 line as a signal that the market may be beginning a new trend. The longer the market has been ranging, the greater the weight that most traders will give this signal.
Example
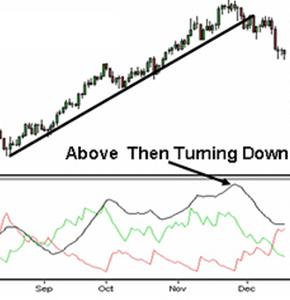
- Another way traders use the ADX is as a signal of trend reversals. When the ADX is trading above both the +DI line and the –DI line and then turns lower this is often a signal that the current trend in the market is reversing and traders will position themselves accordingly.
Example
- Traders use the ADX to position trade long when the +DI crosses above the –DI and to position to trade short when the +DI line crosses below the –DI (as this is a sign that the sellers are winning over the buyers). As with the other crossover strategies, the DI crossover is prone to many false signals.
Example
Apply for Technical Analysis Certification Now!!
http://www.vskills.in/certification/Certified-Technical-Analyst
