Measurement systems need to be adequate, reliable, and correct in their formation. Two major things contribute to total variation – the process and the measurement system. One of the key things you need to do is determine the amount of variability caused by measurement errors, as this is something you need to think about when defining a measurement system. It’s the convergence of people with the techniques used and the variation of how your devices are going to work in the measurement process.
There are a number of important elements in the measurement system – people, standards, devices, environments, instruments and methods. A fishbone diagram can illustrate the challenges in a measurement system with a specific kind of problem. The measurement systems variation should represent a very tiny percentage of the total variation in population of data.
Many different causes of measurement errors can come into play in the context of Lean Six Sigma projects, these include:
- Devices – An example is gauges. You could have issues with calibration or need to deal with challenges related to wear and tear or damage to measuring devices. Maybe there’s a lack of acuity or precision in the actual capability of the measurement devices.
- Methods – If your methods have inherent issues with how you control and maintain quality within your measurement system, that’s going to create a challenge. You may face potential problem areas, such as measuring color acuity or finding devices to measure the shininess of a surface. One thing that’s also really difficult to manage is the sustainability and the susceptibility to human error in the use of methods, as you move through the process.
- Documentation – There could be a lot of issues in this area. For example, you could interpret an instruction in different ways, depending on who’s going to do the measurement. The documentation could also be incomplete, contain errors, or allow you to do measurements in an incorrect sequence.
- Environment – Environmental factors that could come into play include earth tremors, relative humidity, temperature, electrical surges, drops in power, wind, or fluctuations in barometric pressure.
- Person – According to experts, a 100% human inspection is only about 80% to 85% effective. So if you’re highly reliant on human beings to get it right, you could experience a lot of error in your measurement system.
Measurement errors indicate a lack of accuracy and a lack of precision.
Measurement
Attribute Screens
Attribute screens use two categories for determining data outcomes, acceptable or not acceptable, go or no go, pass or fail. This screen is typically used when the percentage of nonconforming material is high or not known. A screen should evaluate the attributes that are most helpful in identifying major problems with a product or process.
Gauge Blocks
Gauge blocks are used in manufacturing to set a length dimension for transfer or for tool calibration. Sets of these blocks usually come in groups of eight to eighty-one. Gauge blocks are accurate to within a few millionths of an inch.
Measuring Tools
Various measurement tools are
- Calipers – They measure distance, depth, height, or length from either an inside or outside perspective. Most calipers capture physical measurements which are transferred to a scale to determine the data. Calipers are of types like
- Spring calipers – The two sides are connected by a spring to measure difficult to reach areas. It’s accurate to a tenth of an inch and uses steel ruler to transfer measurement.
- Vernier calipers – It uses a vernier scale and are accurate to one thousandth of an inch.
- Digital calipers – It uses an electronic readout and are accurate to five thousandths of an inch.
- Optical Comparators – It compares a part to a form that represents the desired dimensions by projecting a beam of light for a shadow of the object that is magnified by a lens for tolerance levels.
- Micrometers – It is also called as “mics”, are handheld measuring devices with a C frame with the measurement occurring between a fixed anvil and a movable spindle. It is similar to calipers with a finely threaded screw with a head to show amount of screw movement with use. It measure items by a combination of readings on a barrel and thimble with accuracy to one thousandth of an inch.
Measurement System
In order to ensure a measurement method is accurate and producing quality results, a method must be defined to test the measurement process as well as ensure that the process yields data that is statistically stable.
Measurement Systems Analysis (MSA) refers to the analysis of precision and accuracy of measurement methods. It is an experimental and mathematical method of determining how much the variation within the measurement process contributes to overall process variability. Characteristics contribute to the effectiveness of a measurement method which is
Accuracy
It is an unbiased true value which is normally reported and is the nearness of measured result and reference value. It has different components as
Bias
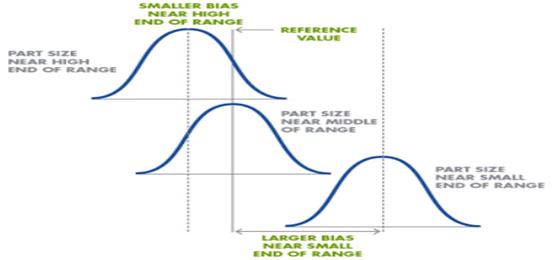
It is the systematic difference between the average measured value and a reference value. The reference value is an agreed standard, such as a standard traceable to a national standards body. The distance between the average measurement and reference value on the x-axis is the bias. Bias can be positive or negative, depending on where the average measured value falls. The reference value is the accepted true value determined by measurement with precision for a particular method – for example, knowing the true weight of a bolt to be 0.03 grams and using that to calibrate a scale. When applied to attribute inspection, bias refers to the ability of the attribute inspection system to produce agreement on inspection standards. Bias is controlled by calibration, which is the process of comparing measurements to standards. To calculate bias, you first calculate the average measurement of the part. Bias would equal that average measurement minus the reference value for your gauge.
Linearity
It is the difference in bias through measurements. How does the size of the part affect the accuracy of the measurement method? The linearity errors are, with respect to how much change you’re likely to see over time with measurements. Linearity is a linear change in bias over the operating range of the actual measurement device. This is true in both manufacturing and services settings. Your system should be equally accurate for all of the measuring levels. You need to measure ten different parts or samples at least five times each to get a good set of data to do the calculations. For example, the weigh scale for materials in a warehouse if a foreman finds a 2-kg error when measuring a load of 100 kg. He continues to take measurements and finds they’re off by 6 kgs for a 200 kg load. If the 2-kg error for the first 100 kgs was indicative of performance and measurements are still off 2 kgs with a weight of 200 kgs, that’s one thing. However, a 6-kg difference at 200 kgs would suggest this is not linear. It is found by, calculate bias, and perform linear regression, for a linear regression graph, if the slope is different from one, it’s non-linear. If the intercept is different from zero, the gauge has a bias. A sloped line indicates the presence of linearity in a graph. The graph plots bias on the y-axis and reference value on the x-axis. The formula for calculating linearity (L) is – L = bV(subscript p), where b, would be the slope, multiplied by the amount of process variation, or V(subscript p) that’s measured in the process.
Stability
It is the change of bias over time and usage. How accurately does the measurement method perform over time? You want to see the same results for the same sample over time when using your measurement system. A lack of stability could indicate special cause variation in your data.
A stability study includes five key steps
- determine the reference values – after these are established, they should be rechecked periodically
- measure the sample 3-5 times and plot the Xbar chart and the R chart – the Xbar chart measures the process mean and the R chart measures the process range over time
- repeat the measurement from the prior step for 20 days – the appropriate time interval for taking measurements should be shorter if it’s likely that the system is unstable
- calculate control limits and add these to your charts
- perform analysis using control charts
Control charts are a powerful way to maintain measurement systems, and evaluate stability on an ongoing basis. Control charts have upper control limits (UCL), lower control limits (LCL), and a target value, or central line (CL). You should use control charts regularly to check the stability of a measurement system. This will help you determine the right recalibration intervals, the measurement devices, and the process for looking for root causes of problems. This could help you separate special cause, such as wobbly bearings in the machine, from assignable causes, for example related to deterioration in your measurement system.
Sensitivity
The gage should be sensitive enough to detect differences in measurement as slight as one-tenth of the total tolerance specification or process spread.
Precision
It is the ability to repeat the same measurement by the same operator at or near the same time with nearness of measurement in any random measurement.
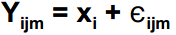
Two major things contribute to total variation – the process and the measurement system. The formula for calculating measurement variance is
σ² Measurement = σ² Repeatability + σ² Reproducibility
Measurement variance is the product of repeatability and reproducibility. Variation, variability, and variance are terms which often are interchanged with one another in this kind of discussion and used alternatively in different sources.
The components of precision are
Reproducibility
The reproducibility of a single gage is customarily checked by comparing the results of different operators taken at different times. It is the variation in the average of the measurements made by different appraisers using the same measuring instrument when measuring the identical characteristic on the same part.
The measurement system variation f or reproducibility, appraiser variation (AV) is used – AV concerns the human factor. Are you using different operators or are you remaining consistent? Are you using the same parts and the same devices to reduce the variability of interest? Are you repeating it multiple times? The reason for doing this is to reduce and control appraiser validation issues. This is to prevent issues resulting from having to train many different operators, who may have different interpretations or not follow exactly the same procedures to get consistent results.
Deviation for reproducibility, or σ reproducibility, is equal to the range of total averages, or Xbar-R, divided by a constant based on the sample or subgroup size, or d₂. So you first calculate the Xbar-R, which is the difference between the largest and smallest operator averages, using the following formula – Xbar-R = Xbar max – Xbar min
For example, the largest operator average, or Xbar max, is 6.07 and the smallest operator average, or Xbar min, is .594. Therefore the range of total averages is .013. Then you use the Xbar-R value and the d₂ value to calculate the reproducibility. The Xbar-R value of .013 is divided by the d₂ value of 1.693. That returns a σ reproducibility value of .077.
Repeatability
It is the variation in measurements obtained with one measurement instrument when used several times by one appraiser, while measuring the identical characteristic on the same part. Variation obtained when the measurement system is applied repeatedly under the same conditions is usually caused by conditions inherent in the measurement system.
The measurement system variation for repeatability, equipment variation (EV) is used – EV uses the same operators and the same parts to reduce the variable of interest, in terms of what is being used as a base line. It uses the same device and is repeated multiple times to validate repeatability. When you see issues with repeatability, often you’ll get into root cause analysis and find these kinds of problems. Problems could result from a different viewing angle on the part of the operator, leading to variation in repeatability or tools wearing out and compromising precision and repeatability.
Repeatability serves as the foundation that must be present in order to achieve reproducibility. Reproducibility must be present before achieving accuracy. Precision requires that the same measurement results are achieved for the condition of interest with the selected measurement method.
A measurement method must first be repeatable. A user of the method must be able to repeat the same results given multiple opportunities with the same conditions. The method must then be reproducible. Several different users must be able to use it and achieve the same measurement results. Finally, the measurement method must be accurate. The results the method produces must hold up to an external standard or a true value given the condition of interest.
Assessing the accuracy of a measurement system involves examining three different areas:
- gauge linearity – With respect to linearity, bias studies determine if you’re measuring accurately, how accurate you are across the range of measurements, and how well you compare to a reference value.
- gauge stability – With gauge stability, you’re testing for the variation of measurement with a series of parts with different measures – testing if you can repeat accurately on repeated measures of the same kinds of items.
- gauge bias – The basics of what happens in bias and linearity studies are that you’re testing the accuracy of the measurement system by comparing the measurements made by the gauge or the measurement tool to a given set of known reference values.
Gauge R and R Studies
Assuming that a gauge is determined to be accurate (that is, the measurements generated by the gauge are the same as those of a recognized standard), the measurements produced must be repeatable and reproducible. A study must be conducted to understand how much variance (if any) observed in the process is due to variation in the measurement system.
Gauge repeatability and reproducibility (GR&R) studies are used to,
- to assess the precision of a measurement system
- to determine the percentage variation caused by the measurement system in the overall variation observed
- to determine the focus for minimizing measurement system variation going forward
There are four key steps in a GR&R study:
- Prepare – This involves ensuring that the gauge, device calibration and standardization, and duplicate production conditions are in place for the study. You need to make sure that gauge is capable of making accurate readings and create a randomization plan for taking the samples.
- Collect resources – This involves collecting the operators, getting the testing equipment in order, and gathering the parts and the samples that you’re going to measure.
- Collect data – You need to ensure consistency and avoid bias among your operators and the recorders during the data collection exercise.
- Calculate repeatability and reproducibility – These calculations are usually done using a computer but you can also use software calculators.
For example, GR&R study about steel pins for the length of ten steel pins that have been measured three different times by three different operators, each using the same measurement device.
The measurement results are recorded in centimeters. For each operator or measure, you record the values for each part being measured in each of the three trials. Then the average measure per part per trial is calculated and recorded as the mean average. From there, you can calculate the Xdouble-bar or the average of all ten of the values, for each operator.
As an example, Operator 1 conducts three trials for Part 1. Trial 1 has a measurement of 5.6 cm, Trial 2 has a measurement of 5.9 cm, and Trial 3 has a measurement of 6.3 cm. The average of these measurements is 5.93 cm. The average of all ten parts measured by Operator 1 is 6.005. This would be shown in the Xdouble-bar column.
The range per part and the average range per trial are also calculated and recorded. In this scenario, Operator 1 conducts three trials for Part 1 and the range per part is 0.7 cm. The average range of all ten parts measured by Operator 1 is 1.31 cm. This would be shown in the R bar column.
There is significance in knowing the repeatability and reproducibility values. Comparing the two values allows you to determine which is larger and consequentially, which is the larger source of variance. In the steel pin GR&R study example, repeatability has a value of .082, which is larger than reproducibility, which has a value of .077. Because repeatability contributes more variation, it should receive a higher priority.
The final step in calculating the gauge R&R value is to determine the overall amount of measurement system variation. This is calculated as
σ² = variance: σ² measurement = σ² repeatability + σ² reproducibility
You have to convert those repeatability and reproducibility values into standard deviations for the variances. This is done by squaring the standard deviations and then adding them. In the steel pin GR&R study example, the calculation is as – 0.82² + 0.077² = 0.6724 + 0.0059 = 0.6783. Therefore the measurement system variance is 0.6783.
The most widely used methods to quantify measurement errors are
- Range Method – The range method is a simple way to quantify the combined repeatability and reproducibility of a measurement system.
- Average and Range Method – The average and range method computes the total measurement system variability, and allows the total measurement system variability to be separated into repeatability, reproducibility, and part variation. It is outlined by AIAG and is a control chart model using averages and range to study variability in measurement methods. This model requires two or three replications (r), by two or three appraisers (k), on 10 parts (n). The average range value is computed as
The average range value is proportionate to the standard deviation of the process. The average range provides another source of understanding the variation using a specific measurement method.
- Analysis of Variance Method – ANOVA is the most accurate method for quantifying repeatability and reproducibility and allows the variability of the interaction between the appraisers and the parts to be determined. It separates the total variability found within a data set into random and systematic factors. The random factors do not have any statistical influence on the given data set, while the systematic factors do. It is used mainly to compare the means of two or more samples though, estimates of variance are the key intermediate statistics calculated.
For example to check quality of packing boxes being manufactured at different factories with same manufacturing setup and output of a company, the box samples must be inspected before they reach the customer. Though, there is low variation in the size or other characteristics of the boxes ANOVA answers the question of whether the differences (variance) in the boxes made within each factory are “large” compared to the differences (variance) in the means for the boxes made at the different factories. Hence, an ANOVA computation compares the variances among the means to the variances within the samples. What it takes to be “large enough” for the difference to be statistically significant depends on the sample sizes and the amount of certainty that is needed in testing.
ANOVA can also report at the interaction between those involved in looking at the measurement method and the attributes/parts themselves. ANOVA partitions the total variation as
- Choose a small number of parts (usually ten or fewer) in a random manner.
- Select a characteristic to be measured.
- Number the parts to identify each part specifically.
- Select a few technicians or inspectors – usually five or fewer
- Require technicians or inspectors to measure the parts using the same measuring device.
- Repeat above step to obtain two complete sets of data.
- Conduct an ANOVA analysis beginning with the construction of an ANOVA table.
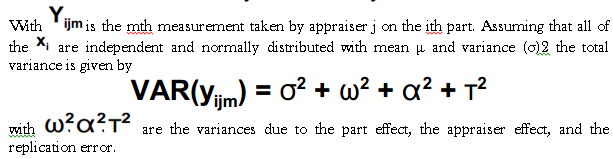
The observed value using an ANOVA study is
Observed Value = Part Mean + Bias + Part Effect + Appraiser Effect + Replication Error
or Observed Value = Reference Value + Deviation
and in equation format
Measurement Correlation
It means the correlation or comparison of the measurement values from one measurement system with the corresponding values reported by one or more different measurement systems. A measurement system or device can be used to compare values against a known standard. The measurement system or device may also be compared against the mean and standard deviation of multiple other similar devices, all reporting measurements of the same or similar artifacts, often referred to as proficiency testing or round robin testing.
Measurement correlation can also mean comparison of values obtained using different measurement methods used to measure different properties. Examples are correlation of hardness and strength of a metal, temperature and linear expansion of an item being heated, and weight and piece count of small parts. It may also identify issues with the measuring device that can be corrected. Besides repeatability and reproducibility, other components whose combined effect explains measurement correlation are bias, linearity and P/T variation.
Bias
It is often due to human error. Whether intentional or not, bias can cause inaccurate or misleading results. In other words, bias causes a difference between the output of the measurement method and the true value. Types of bias include
- Participants tend to remember their previous assessments so, collect assessment sheets immediately after each trial, change the order of the inputs, transactions or questions and include an adequate waiting period after the initial trial to make remembering details of the trial less likely.
- Participants spend extra time when they know they are being evaluated, so give specific time frames.
- When equipment is set wrong.
If an instrument underestimates, the bias is negative. If an instrument overestimates, the bias is positive. The equation for bias is
Linearity
It is the variation between a known standard throughout the operating range of the gauge. The purpose of measurement linearity is to determine the reliability of a measuring instrument by indicating any linearity error or change in the accuracy of the measuring instrument.
When measuring linearity, draw a line through the data points to view a slope (b). The slope is a “best fit” line that runs through the data points. Linearity is equal to the slope multiplied by the process variation Vp (tolerance or spread). Typically, the lower the absolute value of the slope, the better the linearity. The percent linearity is equal to the slope, b , of the best-fit straight line through the data points, and the linearity is equal to the slope multiplied by process variation, as

The bias at any point can be estimated from the slope and the y-intercept, of the best-fit line, as

If gauge linearity error is relatively high it is due to the gauge is not being calibrated properly at both the lower and upper ends of its operating range, there are errors in the minimum or maximum master, the gauge is worn or the internal gauge has faulty design characteristics.
Percent Agreement
Percent agreement between the measurement system and either reference values or the true value of a variable being measured, can be estimated using a correlation coefficient, “r”. If r = ±1.0, then there is 100 percent agreement and if r = 0, then there is 0 percent agreement between the measurement system variables and the reference or true values.
Precision-Tolerance Ratio
Precision/Tolerance (P/T) is the ratio between the estimated measurement error (precision) and the tolerance of the characteristic being measured, where 6σE is the standard deviation of the measurement system variability, as

The P/T ratio needs to be small to minimize the effect of measurement error. As the P/T ratio becomes larger, the measurement method loses its ability to indicate a real change in the process. Values of the estimated ratio [P/T] of 0.1, or less, often are taken to imply adequate gauge capacity. This is based on the generally used rule that requires a measurement device to be calibrated in units one-tenth as large as the accuracy required in the final measurement though it is not applicable every time hence, the gauge must be sufficiently capable to measure product accurately enough and precisely enough so that the analyst can make the correct decision.
The formula for P/T ratio assumes that measurement errors are independent, measurement errors are normally distributed and measurement error is independent of the magnitude of the measurement.
Metrology
It is the science of measurement. The word metrology derives from two Greek words: matron (meaning measure) and logos (meaning logic). Metrology involves the following
- The establishment of measurement standards that are both internationally accepted and definable
- The use of measuring equipment to correlate the extent that product and process data conforms to specification
- The regular calibration of measuring equipment, traceable to established international standards
Measurement Error
Measurement error is the degree to which the measuring instrument differs from a true value. The error of a measuring instrument is indication of a measuring instrument minus the true value, as

Measurement error is due to factors, as
- Operator variation – This occurs when the same operator realizes variation when using the same equipment with the same standards.
- Operator to operator variation – This occurs when two or more operators realize variation in results while using the same equipment with the same standards.
- Equipment variation – The equipment exhibits erratic measurement results.
- Process variation – This occurs when there are two or more methods for using measurement equipment and those methods yield different results.
- Other variation – It includes material variation, software variation, etc.
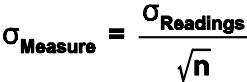
The confidence interval for the mean of measurements is reduced by obtaining multiple readings according to the central limit theorem using the following relationship
Total Product Variability
The total variability in a product includes the variability of the measurement process, as

Calibration
Calibration is the comparison of a measurement standard or instrument of known accuracy with another standard or instrument to detect, correlate, report or eliminate by adjustment, any variation in the accuracy of the item being compared. The elimination of measurement error is the primary goal of calibration systems. The calibration systems is used for
- Ensures that products and services meet the tolerance range and quality specifications. A well-maintained calibration system has a positive impact on the quality of products and services offered to the customer
- Ensures that measuring equipment is recalled from use when it is time to be recalibrated. Periodic recalibration of measuring and test equipment is necessary for measurement accuracy
- Ensures that measuring equipment is removed from use when it is incapable of performing its function with an agreed level of accuracy
Calibration achieves the following goals, as
- Reduce quality costs through the early detection of nonconforming products and processes with the use of measuring equipment of known accuracy
- Provide customers with an indication of a supplier’s calibration capabilities
Calibration Schedule
Measuring equipment should be calibrated before initial use and periodically recalibrated as often as necessary to maintain prescribed accuracies. When production is continuous, a frequency (or interval) is usually established. When production is sporadic, calibration is often done on a “prior to use” basis. The recalibration interval will depend on variables such as historical information, stability, purpose, extent of use, tendency to wear or drift, how critical the measurement is, the cost of an inaccurate measurement, the environment in which it is used, etc. Measuring and test equipment should be traceable to records that indicate the date of the last calibration, by whom it was calibrated and when the next calibration is due. Coding is sometimes used. It is generally accepted that the interval of calibration of measuring equipment be based on stability, purpose and degree of usage.
- The stability of a measurement instrument refers to the ability of a measuring instrument to consistently maintain its metrological characteristics over time.
- The purpose is important, in general, the critical applications will increase frequency and minor applications would decrease frequency.
- The degree of usage refers to how often an instrument is utilized and to what environmental conditions an instrument are exposed.
Calibration Standards
In the SI system, most of the fundamental units are defined in terms of natural phenomena that are unchangeable. This recognized true value is called the standard.
Primary reference standards consist of copies of the international kilogram plus measuring systems which are responsive to the definitions of the fundamental units and to the derived units of the SI table. National standards are taken as the central authority for measurement accuracy, and all levels of working standards are traceable to this “grand” standard.
