You can debug Node.js application using various tools including following:
- Core Node.js debugger
- Node Inspector
- Built-in debugger in IDEs
Core Node.js Debugger
Node.js provides built-in non-graphic debugging tool that can be used on all platforms. It provides different commands for debugging Node.js application. Consider the following simple Node.js application contained in app.js file.
app.js
var fs = require(‘fs’);
fs.readFile(‘test.txt’, ‘utf8’, function (err, data) {
debugger;
if (err) throw err;
console.log(data);
});
Write debugger in your JavaScript code where you want debugger to stop. For example, we want to check the “data” parameter in the above example. So, write debugger; inside callback function as above.
Now, to debug the above application, run the following command.
node debug app.js
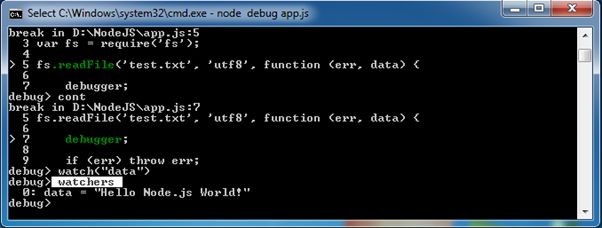
The above command starts the debugger and stops at the first line as
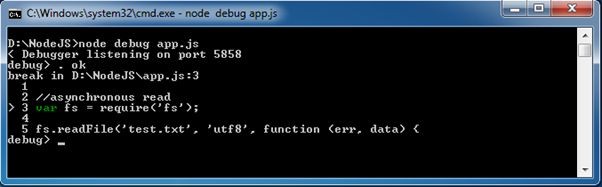
As you can see in the above figure, > symbol indicates the current debugging statement.
Use next to move on the next statement.
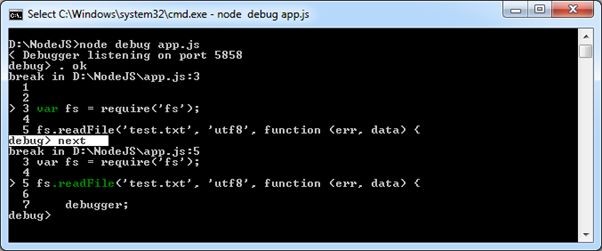
In the above figure, next command will set the debugger on the next line. The > is now pointing to next statement.
Use cont to stop the execution at next “debugger”, if any.
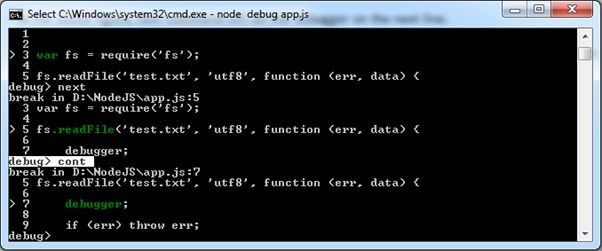
In the above figure, you can see that cont command stops at the “debugger”.
Use watch(‘expression’) command to add the variable or expression whose value you want to check. For example, to check the value of data variable in the above example, add data into watch expression as shown below.
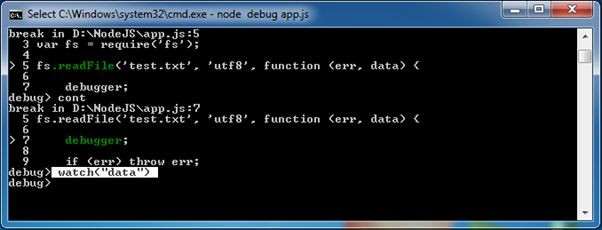
Now, write watchers command to check the value of all the variables added into watch().
The following table lists important debugging commands:
| Command | Description |
| next | Stop at the next statement. |
| cont | Continue execute and stop at the debugger statement if any. |
| step | Step in function. |
| out | Step out of function. |
| watch | Add the expression or variable into watch. |
| watcher | See the value of all expressions and variables added into watch. |
| Pause | Pause running code. |
Thus, you can use built-in Node.js debugger to debug your Node.js application. Visit Node.js official documentation to know all the Node.js debugging commands or write “help” in debug mode in the Node.js console (REPL).
Node Inspector
In this section, we will use node inspector tool to debug a simple Node.js application contained in app.js file.
app.js
var fs = require(‘fs’);
fs.readFile(‘test.txt’, ‘utf8’, function (err, data) {
debugger;
if (err) throw err;
console.log(data);
});
Node inspector is GUI based debugger. Install Node Inspector using NPM in the global mode by writing the following command in the terminal window (in Mac or Linux) or command prompt (in Windows).
npm install -g node-inspector
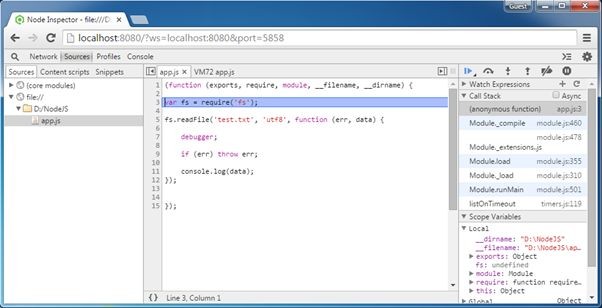
After installing run it using node-inspector command. It will display an URL for debugging purpose. So, point your browser to http://127.0.0.1:8080/?ws=127.0.0.1:8080&port=5858 and start debugging. Sometimes, port 8080 might not be available on your computer. So you will get the following error. Cannot start the server at 0.0.0.0:8080. Error: listen EACCES.
In this case, start the node inspector on a different port using the following command.
D:\>node-inspector –web-port=5500
Now, open Google Chrome browser and enter the URL – localhost:8080/?ws=127.0.0.1:8080&port=5858
Now, open another terminal window or command prompt in Windows and start debugging using the following command.
> node –debug-brk app.js
Refresh the browser and you will see that it stops at the first line of the program as shown below.
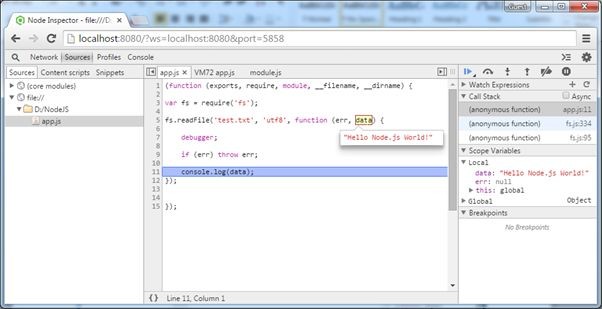
Now, debug the program as a normal program in Chrome developer tool. Also, use watch expression on the right pane or hover the cursor on the variable to see the value as shown below.
In this way, Node Inspector can be used to debug in Windows or MAC OS.
