The Fama-French Three Factor Model is a method used to explain the risk and return of equity portfolios. The Three Factor Model compares a portfolio to three distinct risks found in the equity market to assist in decomposing returns. Before the Three Factor Model, there was the CAPM, a single factor way to explain portfolio returns. This tutorial is a quick explanation of CAPM and the Three Factor Model.
The CAPM is used determine a theoretically appropriate required rate of return of any investment. CAPM takes into account the expected riskiness of the stock market, known as “beta”, and compares the riskiness of an investment to market beta. If the beta of any investment is higher than the market, then the expected return is also higher and vice versa. The beta of a diversified portfolio can also be measured and compared to the market beta. If a portfolio has higher beta than the market, it is expected to achieve higher returns and vice versa.
All diversified stock portfolios have beta. After testing CAPM on numerous portfolios, Fama and French found that on average, a portfolio’s beta explains about 70% of its actual returns. For example, if a portfolio was up 10%, about 70% of the return can be explained by the advance of all stocks and the other 30% is due to other factors not related to beta. Fama-French designed a more elaborate model that uses three risk factors.
In the Three Factor model, beta is still the most important risk factor because it still accounts for 70% of the typical diversified portfolio return. However, the size of the stocks in a portfolio and the price-to-book value of the stocks made significant differences.
Size is the second risk factor in the Three Factor Model. This factor compares the weighted average market value of the stocks in a portfolio to the weighted average market value of stocks on the market. Small stocks tend to act very differently than big stocks in almost all market conditions.
In the long run, small stocks have generated higher returns than large stocks, although the extra return is not free. There is more risk in small stocks. Fama and French call size risk a different yet important factor in portfolio returns.
The third factor compares the amount of value stock exposure in relation to the market. Value stocks are companies that tend have lower earnings growth rates, higher dividends, and higher book value compared to price (BtM).
Fama-French measured the performance of high BtM stocks (value stocks) against low BtM stock (growth stocks) and found that these two styles act very differently. In the long run, value stocks have generated higher returns than growth stocks, albeit because value stocks have higher risk.
Various stock portfolios were tested against their model and found that a combination of beta, size, and value explained 95% of a diversified portfolio’s return. That is, when analyzing the returns of a diversified stock portfolio against the stock market, 95% of the return could be explained by the portfolio’s sensitivity to the market (beta), the size of stocks in the portfolio (size), and the average weighted book-to-market (BtM). The Fama-French Three Factor Model was far better than the 70% explanatory power of beta alone using CAPM.
The three factor Fama-French model is written as.

Where,
SA and HA capture the security’s sensitivity to these two additional factors.
SMB (Small Minus Big) measures the additional return investors have historically received by investing in stocks of companies with relatively small market capitalization. This additional return is often referred to as the “size premium.”
HML (High Minus Low) has been constructed to measure the “value premium” provided to investors for investing in companies with high book-to-market values.
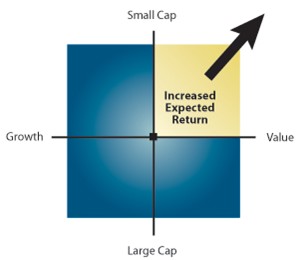
In the above diagram, the horizontal axis (X-axis) is the “Value” factor, represented as SMB. The left side (more negative) is termed “Growth,” the right side (more positive) is “Value.”
The vertical axis (Y-axis) is the “Size” factor, represented as HML.
The upper side (more positive) is termed “Small Cap,” the lower side (more negative) is “Large Cap.” At the plot origin (0, 0) is the “The Market,” the baseline reference.
Apply for Hedge Fund Certification!
https://www.vskills.in/certification/certified-hedge-fund-manager
