How to Inspect Elements in Browser
There is information that cannot be seen on web page front end. But if you want to know really what is happening if you open any webpage you can inspect elements.
Certainly, you can easily find information about web page by inspecting the page or any particular element. However, HTML information of any element can be found by clicking on Element. Moreover, plug-ins like Firebug also provides the same functionality.
Chrome DevTools
The Chrome Developer Tools is a set of web authoring and debugging tools built into Google Chrome. The DevTools provide web developers deep access into the internals of the browser and their web application. Moreover, it uses the DevTools to efficiently track down layout issues, set JavaScript breakpoints, and get insights for code optimization.
There are several useful shortcuts for opening the DevTools:
- Firstly, use Ctrl+Shift+I (or Cmd+Opt+I on Mac) to open the DevTools.
- Secondly, use Ctrl+Shift+J (or Cmd+Opt+J on Mac) to open the DevTools and bring focus to the Console.
- Lastly, use Ctrl+Shift+C (or Cmd+Shift+C on Mac) to open the DevTools in Inspect Element mode.
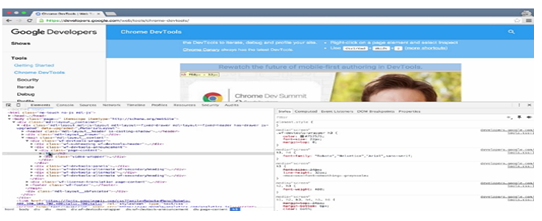
The DevTools are organised into task-oriented groups in the toolbar at the top of the window. Further, the let you work with a specific type of information. Above all, there are eight main groups of tools available to view Developer Tools.
Internet Explorer and Edge
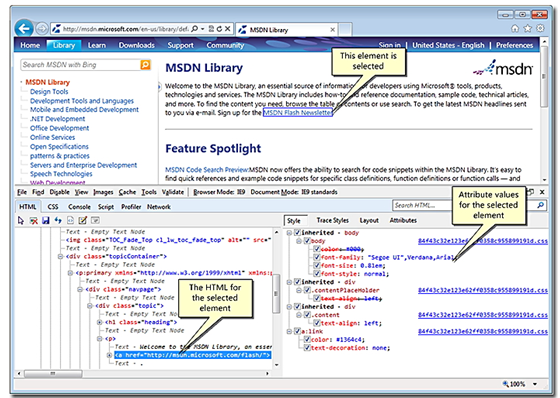
Internet Explorer also has its own Developer Tool that can be used to identify web elements. However, the user is not required to download or install any separate plugin. As the developer tool comes readily bundled with Internet Explorer.
Moreover, the code level tools are accessed through six dedicated tabs that provide HTML, CSS, and script debugging. In addition, the Console tab offers a way to receive and view messages that you can send from within your code using the console commands.
To make finding specific elements in a large DOM tree, you can select individual elements in the browser, and have them highlighted in the HTML tab of the F12 tools. From the F12 tools debugging window, click the Select Element by Click button Picture of the Select Element by Click button, or press Ctrl + B to highlight elements on the webpage as you hover on the page. When you click a highlighted element, the HTML tab will open and scroll to the selected element in the code pane. In some situations, you might need to refresh the HTML tab to see the element.
Edge Browser
The Microsoft Edge F12 DevTools are built with TypeScript, powered by open-source, and optimized for modern front-end workflows.
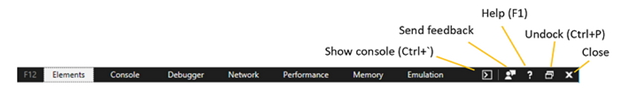
The Microsoft Edge F12 DevTools include:
- Firstly, an Elements panel to edit HTML and CSS, inspect accessibility properties, view event listeners, and set DOM mutation breakpoints
- Secondly, a Console to view and filter log messages, inspect JavaScript objects and DOM nodes, and run JavaScript in the context of the selected window or frame
- Further, a Debugger to step through code, set watches and breakpoints, live to edit your code and inspect your web storage and cookie caches
- Subsequently, a Network panel to monitor and inspect requests and responses from the network and browser cache
- After this, the performance panel to profile the time and system resources required by your site
- In addition, a Memory panel to measure your use of memory resources and compare heap snapshots at different states of code execution
- Lastly, an Emulation panel to test your site with different browser profiles, screen resolutions, and GPS location coordinates
Safari Browser
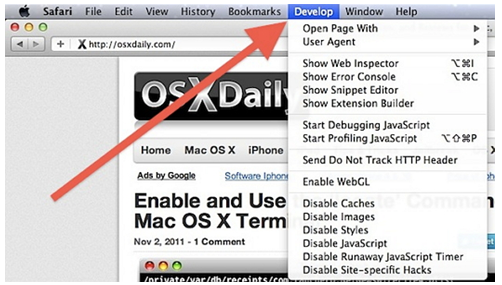
The Safari Develop menu provides tools which make sure your website works well with all standards. If you don’t see the Develop menu in the menu bar, choose Safari > Preferences, click Advanced. After this, select “Show Develop menu in the menu bar.”
Mozilla Firefox
The Web developer option under Tools menu has various tools for web development and testing.
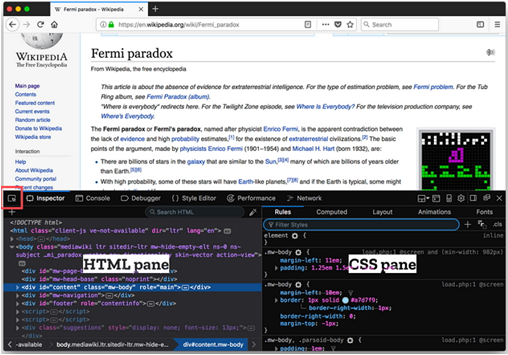
Certainly, the Inspector is used to examine and modify the HTML and CSS of a page. Moreover, there are two main ways to open the Inspector
- First of all, without an element selected: choose “Tools -> Web Developer -> Inspector” from the Menu Bar or the equivalent keyboard shortcut.
- Subsequently, with an element selected: right-click an element on a web page and select “Inspect Element”.
Various tools in Firefox are
- Firstly, the Inspector gives you detailed information about the currently selected element. The Select element button is one way you can select an element for inspection.
- Secondly, the Web Console logs information associated with a web page: network requests, JavaScript, CSS, security errors and warnings as well as error, warning and informational messages explicitly logged by JavaScript code running in the page context. It also enables you to interact with a web page by executing JavaScript expressions in the context of the page
- Subsequently, the JavaScript Debugger enables you to step through JavaScript code and examine or modify its state to help track down bugs.
- Moreover, the Network Monitor shows you all the network requests Firefox makes (for example, when it loads a page, or due to XMLHttpRequests), how long each request takes, and details of each request.
- Lastly, the Performance tool gives you insight into your site’s general responsiveness, JavaScript and layout performance. With the Performance tool, you create a recording, or profile, of your site over a period of time. The tool then shows you an overview of the things the browser was doing to render your site over the profile and a graph of the frame rate over the profile.
Firebug and FirePath: Elements in Browser
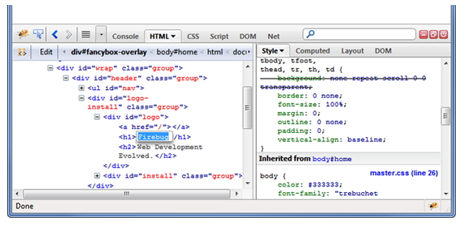
Both Firebug and Fire path are plugins of Mozilla Firefox browser but are not compatible with the new version. Further, they need to be installed from Firefox plugin a website and Firefox needs to be restarted. Moreover, they were used with Selenium IDE to create Selenium tests.
In addition, Firebug integrates with Firefox to put a wealth of development tools at your fingertips while you browse. You can also edit, debug, and monitor CSS, HTML, and JavaScript live in any web page.
FirePath is a Firebug extension that adds a development tool to edit, inspect and generate XPath 1.0 expressions, CSS 3 selectors and JQuery selectors (Sizzle selector engine).
A great career is just a certification away. So, practice and validate your skills to become Certified SoapUI Testing Professional
