Three subjective techniques used for facility location are Industry Precedence, Preferential Factor and Dominant Factor. Most of us are always looking for some precedents. So in the industry precedence subjective technique, the basic assumption .is that if a location was best for similar firms in the past, it must be the best for us now As such, there is. no need for conducting a detailed location study and the location choice is thus subject to the principle of precedence-good or bad. However in the case or the preferential factor, the location decision is dictated by a personal factor. It depends on the individual whims or preferences e.g. if one belongs to a particular state, he may like to locate his unit only in that state such personal
Factors may. Override factors of cost or profit in taking a final decision. This could hardly be called a professional approach though such methods are probably more common in practice than generally recognized. However, in some cases of plant location there could be a certain dominant factor (in contrast to the preferential factor) which could influence the location decision. In a true dominant sense, mining or petroleum drilling operations must be located where the mineral resource is available. The decision in this case is simply whether to locate or not at the source.
For evaluating qualitative factors, some factor ranking and factor weight rating systems may be used. In the ranking procedure, a location is better or worse than another for the particular factor. By weighing factors and rating locations against these weights a semi-quantitative comparison of location is possible. Let us now discuss some specific methods.
Equal Weights Method
We could assign equal weights to all factors and evaluate each location along the factor scale. For example, Banson, a manufacturer of fabricated metal products selected three factors by which to rate four sites. Each site was assigned a rating of 0 to 10 points for each factor. The sum of the assigned factor points constituted the site rating by which it could be compared to, other sites.
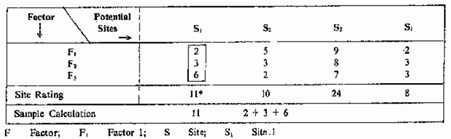
Looking at Table 2, Site 3 has the highest site rating of 24. Hence, this site would be chosen.
Variable Weights Method
The above method could be utilized on account of giving equal weight age to all the factors. Hence, we could think of assigning variable weights to each of the factors and evaluating each location site along the factor scale. Hence, factor Fi. Might be assigned 300 points, factor 2 might be assigned 100 points and factor 3 might be assigned 50 points. Thus the points scored, out of the maximum assigned to each of the factors, for each possible location site could be obtained and again the site rating could be derived as follows:
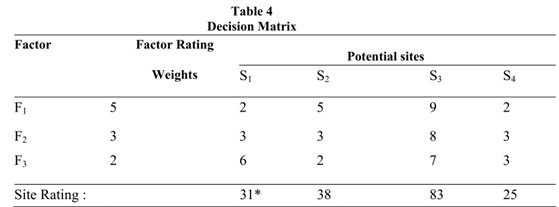
*Sample Calculation 31= (5) ×2+ (3) ×3+ (2) ×6
As shown in Table 4, the sample calculation should hopefully suffice to obtain the site ratings. Hence, site S3 with the highest rating of 83 is chosen.
Factor-Point Rating Method
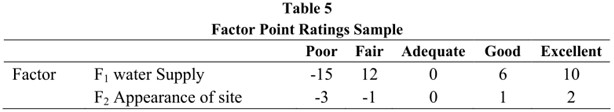
Now for a last one, establish a subjective.- scale common to all factors. Assign points against the subjective scale for each factor and assign the factor points of the subjective rating for each factor. For example, five subjective ratings–Poor, Fair, Adequate, Good and Excellent were selected to be used in evaluating each site for each factor. For each of the factors, `adequate’ was assigned a value zero and then negative and positive relative worth weights were then assigned the subjective ratings below and above adequate for each factor in Table 5.
The range between minimum and maximum weights assigned; to a factor in effect weighs that factor against all other factors in a manner equivalent to the method (iii) described just previous to this one. Each location site S1 to S4 were then rated by selecting the applicable subjective rating for each factor for each, location and the equivalent points of that subjective factor rating assigned to the factor. Thus we can now obtain Table 6.
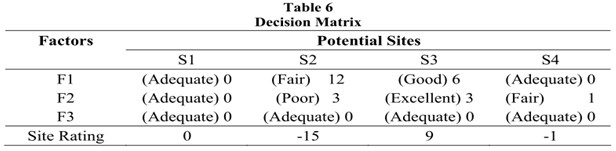
*Sample Calculation – 15 = (-12) + (-3) + (0)
Accordingly Site 3 with the highest rating of 9 would be chosen.
In most cases, hardly any attempt is made to establish a direct relationship between the site rating point value and the cost values. Usually, this is left to the management
The location analyst presents to management both the cost and the intangible data results. In such cases, management could take a decision based on a simple composite measure method illustrated below with the aid of a numerical example.
Composite Measure Method
Let us enlist the steps of the composite measure method
Step-1 Develop a list of all relevant factors.
Step-2 Assign a scale to each factor and designate some minimum.
Step-3 Weigh the factors relative to each other in light of importance towards achievement of system goals.
Step-4 Score each potential location according to the designated scale and multiply the scores by the weights.
Step-5 Total the points for each location and either (a) use them in conjunction with a separate economic analysis, or (b) include an economic factor in the list of factors and choose the location on the basis of maximum points.
Now let us illustrate the composite measure method with a numerical example. There are three potential sites and five relevant factors like transportation costs per week, labour costs per week, finishing material supply, maintenance facilities and community attitude. The costs are in rupees whereas for the last three factors, points are assigned on 0-100 scale. The data collected is shown in Table 7 below.
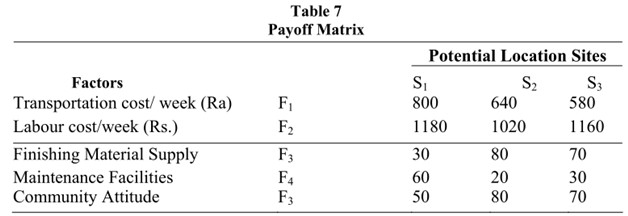
The location analyst has pre-established weights for various factors. This includes a standard of 1.0 for each Rs. 10 a week of economic advantage. Other weights applicable are 2.0 on finishing material supply, 0.5 on maintenance facilities and 2.5 on community attitudes. Also the organization prescribes a minimum acceptable score of 30 for maintenance facilities.
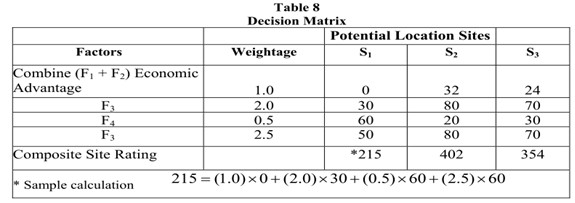
First of all let us look at the economic factors F1 and F2 for which monetary values were possible. If we total the costs for each site, we get the costs for sites S1, S2 and S3 as Rs. 1980, Rs. 1660 and Rs. 1740, respectively. Thus site St would be the worst cost wise. Site S2would have an economic advantage over site St to the extent of Rs. (1980 -1660) = Rs. 320. Similarly, site S3 would have an economic advantage over site St to the extent of Rs. (1980 -1740) = Rs. 240. Now the monetary value in Rs. can be converted to a point scale as you would realize that a standard of 1.0 is to be assigned for each Rs. 10 per week of economic advantage. Thus we could get the following Table 8.
Activity A
Facilities Location Based on the previous table, the location analyst chose site S2 on the Basis that site S2 has a maximum location site rating of 402. Do you agree? State reasons for either agreeing or disagreeing
Now on referring to certain prerequisites for certain factors, because of the nature or the situation a constraint in the form of a site scoring at least 30 on account of maintenance had been given. You would be able to observe that this basic requirement is not met by site S2. In fact any further calculations for S2 need not have been carried out as soon as one detected this flaw. However, we deliberately persisted on going through all the calculations. There could have been the possibility of revision of the maintenance clause constraint viz., perhaps it might have been felt that a bare minimum score of 15 would suffice. In such cases, therefore, it is better to go through all the calculations and when finally taking a decision, do keep the constraints in mind.
