Sometimes, it is useful to draw location break-even charts which could aid in deciding which location would be optimal. The location of a Tractor factory in a South Delhi site will result in certain annual fixed costs, variable costs and revenue. The figures would be different for a South Bombay site. The fixed costs, variable costs and price per unit for both sites are given below in Table 9.
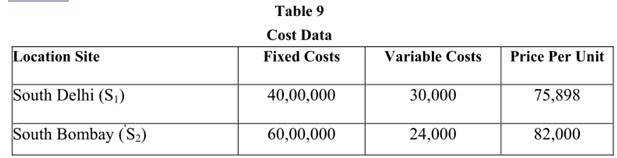
Let us assume that the expected sales volume as estimated by a market research team is 95.
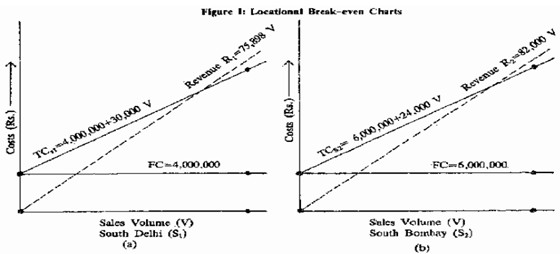
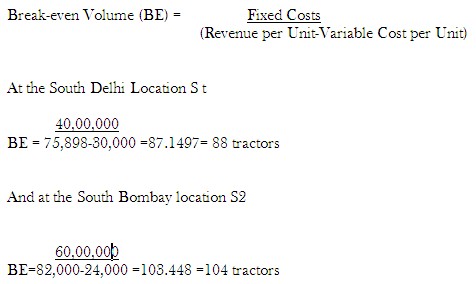
The data of Table 8 is depicted pictorially in Figure I showing the location break-even charts. Now the break-even point is defined to be the point or volume where the total costs equal total revenue. Thus for each site S i and S 2, the break-even point can be determined by using a simple formula (which could be easily derived) as follows:
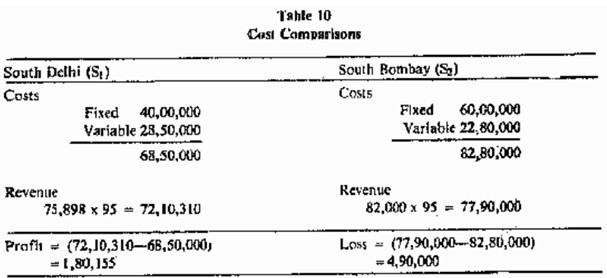
Let us see what would be the profit or loss for the two sites at the expected volume of 95 Units. The calculations are shown in Table 10.
Activity B
What would be the expected revenues for an estimated volume of 95 Units if the factory is located at (i) at South Delhi and (ii) at South Bombay? Where you would like to locate the factory?
Now what do we find? The South Delhi (S1) site is preferable, even though the revenues are lower, since the Company will lose money by locating the plant in south Bombay (S2).
