Six sigma is a method on quality, which is focused on results. It’s also a technique of measurements which results in lower defects which convert into cost savings and competitive advantage.
Sigma (σ), is an mathematical symbol representing one standard deviation from the average or mean. Most control charts set their range at +3σ, but Six Sigma extends three more standard deviations. With six sigma, there are only 3.4 parts per million (PPM) defective. A 6 Sigma level process is operating at 99.9997% quality level.
Six Sigma is defined as a methodology that aims at a quasi-perfect production process. It is also defined as a methodology that aims at a rate of 3.4 defects per million opportunities (DPMO).
In the design phase of any process, the customers’ needs and expectations are identified and translated into Critical-To-Quality (CTQ) characteristics. These characteristics are put into the products’ design so as to manufacture or deliver it consistently and economically. But variability comes during delivery or manufacture hence, tolerance levels are specified thus, the company should measure and control the variations. Then the process performance is measured to know how the output against specified limits by the process capability or the ability of the process to generate products that are within the specified limits, and the process stability or company’s ability to predict the process performance based on past experience. Usually the SPC is used with sample being tested at specified intervals and estimation is derived for whole to know number of defects.
The basic foundation of Six Sigma is the defects per million opportunities (DPMO) metric. DPMO is a scientific measure and a way to look at the number of mistakes or defective results you would get from a product or service. This metric sits inside the organizational system within which Six Sigma operates.
The next part of the Six Sigma organizational system is the improvement methodology, within which the DPMO metric resides. This methodology is known as the DMAIC methodology, which stands for Define, Measure, Analyze, Improve, and Control.
Continuous Improvement
Continuous improvement involves constantly identifying and eliminating the causes that prevent a system or process from functioning at its optimum level. The concept of continuous improvement originated in Japan in the 1970s. It was adopted in many countries, including U.S.A., in the early 1980s. Continuous improvement—and consequent customer satisfaction—is the principle on which the concept of Lean manufacturing is developed. When this principle is combined with just-in-time technique, it results to Lean manufacturing. Continuous improvement helps an organization to add value to its products and services by reducing defects, mistakes, etc. and to maximize its potential. As continuous improvement requires constant ongoing efforts, it is essential that the top management takes a long term view and commits itself for its implementation.
Continuous improvement enables organizations identify and rectify problems as and when they occur. Thus, it ensures smooth functioning of the processes. Many modern quality improvement models or tools like control charts, sampling methods, process capability measures, value analysis, design of experiments, etc. have been influenced by the concept of continuous improvement.
Six Sigma History
History of six sigma encompassed various events which shaped it’s formation and spread. Six sigma has evolved over time. It’s more than just a quality system like TQM or ISO. The events for six sigma evolution are as
- Carl Frederick Gauss (1777-1855) introduced the concept of the normal curve.
- Walter Shewhart in 1920’s showed that three sigma from the mean is the point where a process requires correction.
- Following the defeat of Japan in World War II, America sent leading experts including Dr. W. Edwards Deming to encourage the nation to rebuild. Leveraging his experience in reducing waste in S. war manufacture, he offered his advice to struggling emerging industries.
- By the mid-1950s, he was a regular visitor to Japan. He taught Japanese businesses to concentrate their attention on processes rather than results; concentrate the efforts of everyone in the organization on continually improving imperfection at every stage of the process. By the 1970s many Japanese organizations had embraced Deming’s advice. Most notable is Toyota which spawned several improvement practices including JIT and TQM.
- Western firms showed little interest until the late 1970s and early 1980s. By then the success of Japanese companies caused other firms to begin to re-examine their own approaches and Kaizen began to emerge in the S.
- Many measurement standards (Zero Defects, etc.) later came on the scene but credit for coining the term “Six Sigma” goes to a Motorola engineer named Bill Smith. (“Six Sigma” is also a registered trademark of Motorola). Bill Smith, along with Mikel Harry from Motorola, had written and codified a research report on the new quality management system that emphasized the interdependence between a product’s performance in the market and the adjustments required at the manufacturing point.
Various models and tools emerged which are
- Kaizen – It refers to any improvement, one-time or continuous, large or small
- TQM – It is Total Quality Management with Organization management of quality consisting of 14 principles
- PDCA Cycle – Edward Deming’s Plan Do Check Act cycle
- Lean Manufacturing – It focuses on the elimination of waste or “muda” and includes tools such as Value Stream Mapping, the Five S’s, Kanban, Poka-Yoke
- JIT– It is Just in Time Business or catering to needs of customer when it occurs.
- Six Sigma – It is designed to improve processes and eliminate defects; includes the DMAIC and DMADV models inspired by PDCA
Quality Pioneers
Various pioneers emerged who helped shape quality principles and laid the foundations for six sigma. They included
Walter A. Shewhart
He is the pioneer of Modern Quality Control who, recognized the need to separate variation into assignable and un-assignable causes. He is the founder of the control chart and originator of the plan-do-check-act cycle. He was the first to successfully integrate statistics, engineering, and economics and defined quality in terms of objective and subjective quality.
Dr. W. Edwards Deming
He studied under Shewhart at Bell Laboratories and major contributions includes developing 14 points on Quality Management, a core concept on implementing total quality management, is a set of management practices to help companies increase their quality and productivity. The 14 points are
- Create constancy of purpose for improving products and services.
- Adopt the new philosophy.
- Cease dependence on inspection to achieve quality.
- End the practice of awarding business on price alone; instead, minimize total cost by working with a single supplier.
- Improve constantly and forever every process for planning, production and service.
- Institute training on the job.
- Adopt and institute leadership.
- Drive out fear.
- Break down barriers between staff areas.
- Eliminate slogans, exhortations and targets for the workforce.
- Eliminate numerical quotas for the workforce and numerical goals for management.
- Remove barriers that rob people of pride of workmanship, and eliminate the annual rating or merit system.
- Institute a vigorous program of education and self-improvement for everyone.
- Put everybody in the company to work accomplishing the transformation.
Joseph Juran
His major contributions are directing most of his work at executives and the field of quality management and developing the “Juran Trilogy” for managing quality, as Quality planning, quality control, and quality improvement. He also enlightened the world on the concept of the “vital few, trivial many” which is the foundation of Pareto charts.
Philip Crosby
He stressed on Quality management and four absolutes of quality including
- Quality is defined by conformance to requirements.
- System for causing quality is prevention not appraisal.
- Performance standards of zero defects not close enough.
- Measurement of quality is the cost of nonconformance.
Arman Feigenbaum
He developed a systems approach to quality (all organizations must be focused on quality) by emphasizing that costs of quality may be separated into costs for prevention, appraisal, and failures (scrap, warranty, etc.)
Kaoru Ishikawa
He developed the concept of true and substitute quality characteristics as
- True characteristics are the customer’s view
- Substitute characteristics are the producer’s view
- Degree of match between true and substitute ultimately determines customer satisfaction
He also advocated of the use of the 7 tools and advanced the use of quality circles or worker quality teams. He also developed the concept of Japanese Total Quality Control
- Quality first and not short term profits.
- Next process is the customer.
- Use facts and data to make presentations.
- Respect for humanity as a management philosophy of full participation
Genichi Taguchi
He developed the quality loss function (deviation from target is a loss to society) and promoted the use of parameter design (application of Design of experiments) or robust engineering. The goal is to develop products and processes that perform on target with smallest variation insensitive to environmental conditions and the focus is on engineering the design.
Value of Six Sigma
The Six Sigma concept was developed at Motorola in the 1980s. Six Sigma can be viewed as a philosophy, a technique, or a goal.
- Philosophy – Customer-focused breakthrough improvement in processes
- Technique – Comprehensive set of statistical tools and methodologies
- Goal – Reduce variation, minimize defects, shorten the cycle time, improve yield, enhance customer satisfaction, and boost the bottom line
Six sigma is not about quality for the sake of quality; it is about providing better value to customers, investors and employees. Six Sigma is a process of asking questions that lead to tangible and quantifiable answers that ultimately produce profitable results. There are four groups of quality costs, which are
- External failure cost: warranty claims, service cost
- Internal failure cost: the costs of labor, material associated with scrapped parts and rework
- Cost of appraisal and inspection: these are materials for samples, test equipment, inspection labor cost, quality audits, etc..
- Cost related to improving poor quality: quality planning, process planning, process control, and training.
Usually companies are at 3 Sigma level which translates to 25-40% of annual revenue being taken by cost of quality. Thus, if a company can improve its quality by 1 sigma level, its net income will increase hugely, approximately 10 percent net income improvement.
Using mail delivery as an example, a Three Sigma process could result in approximately 20,000 pieces of mail being lost every hour. If the process was at a Six Sigma level, 7 pieces of mail would be lost in an hour. Consider another example in the medical field: a Three Sigma process could cause 5,000 incorrect surgeries a week. At the Six Sigma level, this would be reduced to just 1.7.
Six Sigma is very adaptable, and it’s very easy to see how Six Sigma quality can affect almost every type of industry, be it manufacturing or service. There is no upper or lower limit in terms of the size or type of organization that can be adapted to use Six Sigma successfully.
Furthermore, when the level of process complexity increases (eg. output of one sub-process feeds the input of another sub-process), the rolled throughput yield of the process will decrease, then the final outgoing quality level will decline, and the cost of quality will increase. Project teams with well-defined projects improve the company’s profits.
Meaning of Six Sigma
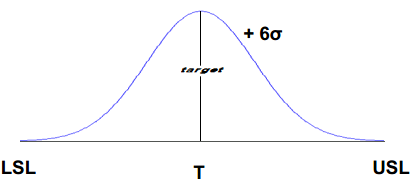
The term ‘Six Sigma’ is drawn from the statistical discipline ‘process capability studies’. Sigma, represented by the Greek alphabet ‘σ’, stands for standard deviation from the ‘mean’. ‘Six Sigma’ represents six standard deviations from the ‘mean.’ This implies that if a company produces 1,000,000 parts/units, and its processes are at Six Sigma level, less than 3.4 defects only will result. However, if the processes are at three sigma level, the company ends up with as many as 66,807 defects for every 1,000,000 parts/units produced.
The table below shows the number of defects observed for every 1,000,000 parts produced (also referred to as defects per million opportunities or DPMO).
| Sigma Level | Defects per million opportunities |
| Two Sigma | 308,507 DPMO |
| Three Sigma | 66,807 DPMO |
| Four Sigma | 6,210 DPMO |
| Five Sigma | 233 DPMO |
| Six Sigma | 3.4 DPMO |
Process standard deviation (σ) should be so minimal that the process performance should be able to scale up to 12σ within the customer specified limits. So, no matter how widely the process deviates from the target, it must still deliver results that meet the customer requirements. Few terms used are
- USL – It is upper specification limit for a performance standard. Any deviation beyond this is a defect.
- LSL – It is lower specification limit for a performance standard. Any deviation below this is a defect.
- Target – Ideally, this will be the middle point between USL and LSL.
Six Sigma approach is to find out the root causes of the problem, symbolically represented by Y = F(X). Here, Y represents the problem that occurs due to cause (s) X.
| Y | x1, x2, x3, …., xn |
| Dependent | Independent |
| Customer related output | Input-process |
| Effect | Cause |
| Symptom | Problem |
| Monitor | Control |
Benefits of Six Sigma
- Continuous defect reduction in products and services
- Enhanced customer satisfaction
- Performance dashboards and metrics
- Process sustenance
- Project based improvement, with visible milestones
- Sustainable competitive edge
- Helpful in making right decisions
Business processes
A business process or a process is a group of tasks which result in a specific service or product for customers. It can be visualized with a flowchart or a process matrix. Business processes are fundamental to every company’s performance and implement the business strategy. Understanding and optimizing the business process is the crux of six sigma.
Frequently, organizations treat the symptoms of a process performance issue without truly understanding the root cause or impact of the issue. Dissecting and truly understanding root cause for process performance is critical to effective process improvement which is can be accomplished by six sigma. Each process, have the three elements of inputs, process and outputs that affect its function. A business process is a collection of related activities that produce something of value to the organization, its stakeholders or its customers.
Having a standard model such as DMAIC (Define-Measure-Analyze-Improve-Control) makes process improvement and optimization much easier by providing the teams with an easy roadmap. This disciplined, structured, rigorous approach consists of steps which are linked logically to the previous step and to the next step. It is not enough for organizations to treat process improvement as one-time or periodic events. A sustaining focus on process management and continuous improvement is the key.
Types of Processes
Processes can be classified as management processes, operational processes and supporting processes.
- Management processes – These processes administer the operation of a system. Some examples of management processes are planning, corporate governance, etc.
- Operational processes – These processes create the primary value stream for the customers. Hence, they are also called ‘core business processes’. Some examples of operational processes are purchasing of raw materials, manufacturing of goods, rendering of services, marketing, etc.
- Supporting processes – These processes support the core business processes of the organization. Some examples of supporting processes are accounting, technical support, etc.
These processes can be divided into many sub-processes that play their intended roles to successfully complete the respective head processes.
Business System
A business system is a group of business processes which combine to form a single and identifiable unit of business as a whole. It is composed of processes, which in turn are composed of sub-processes and which are further composed of individual tasks.
A business system is a system that implements a process or a set of processes. It ensures that all the processes operate smoothly without delays or lack of resources. Six sigma directs business systems to ensure that the processes, products, and services are subjected to continuous improvement and for which collection and analysis of data from processes is initiated.
It is important to have an appropriate business system in place and the relevant processes under the system are well-documented. The documentation of the processes must be done in such a way that every task, activity, and their sequence are taken into account for proper execution as planned for in the business system.
Process Control
Feedback received from process is used for process control thus, focusing on the input and output of the process for data collection. Every sub-process or task act as an input to next task or as output for previous one. Achieving optimum resources usage by a process though keeping quality output by
- Applying feedback loop to collect data from various process stages so as to apply improvisation
- Re-design the process for data collection, analysis and improvisation as part of the process.
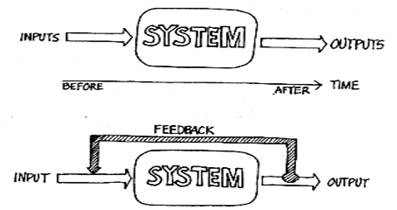
A real-time feedback will initiate improvisation quickly. Tools like control chart helps in data collection and analysis as well.
Transfer Function
The transfer function is Y=f(X). To understand the link between the transfer function and Six Sigma, you can begin with understanding what Y is. If you consider a complete process as inputs flowing into a transformation of sorts, which produces an output, then Y is the output or the result. Y can also be considered as the actual process that you want to improve.
In the function, X is the variables that actually contribute to the success of the process, or the inputs. The f, or function of X, gives you the Y result that you’re looking for. So another way of thinking about this is the X inputs go through the f function of transformation to generate the outputs or the Y value that you’re looking for.
To understand how the transfer function relates to DMAIC, consider the example of calling for technical support for a computer problem. When the customer calls, there’s a series of things that are going to happen. In this instance, the Y is how long it takes for them to get the answer to their question. Next, you would identify the X factors by determining what the various steps are that would take place through the entire contact to resolve a technical question. Once you’ve collected this data, you can proceed to analyze it. Ask questions such as, “What are the critical steps that really take up most of the time?”, “What variations are there?”, “Where is a lot of effort used?”, and “What can I do to actually improve and shorten the amount of time to provide the customer with an answer?” Once you’ve done that, you can move into the Improve phase and actually implement countermeasures and changes. Then from there you need to measure and control to verify that the Y you were looking for is defined.
Six Sigma Green Belt’s Responsibilities
A Six Sigma Green Belt has nearly identical responsibilities as a Black Belt when it comes to projects but they work on less complex challenges or problems than the Black Belt professionals. There are no dedicated Green Belt practitioners in any organization as, most Green Belts retain the positions they had prior to being trained in Six Sigma and use the new skills to improve their working environment and performance. The responsibilities of a Six Sigma Green Belt includes
- Project Management involving defining the project scope, marshal resources, setting up of goals, timelines and milestones and also reporting or updating stakeholders and executives.
- Task Management involving establishing the team’s lean Sigma roadmap, leading the implementation of Six Sigma tools, managing team meetings, tracking and reporting team progress
- Team Management involving selecting team members, manage the team’s organizational interfaces and ensuring the team is trained and equipped for their work.
DMAIC Methodology
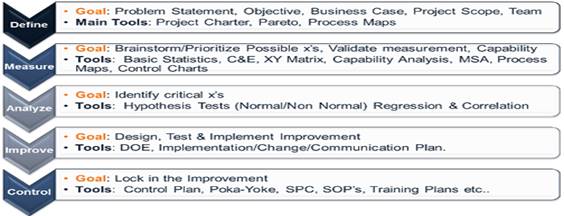
The Six Sigma methodology is conceptually based a five phase project. Each phase has a specific purpose and specific tools and techniques which aid in achieving the phase objectives as well as lead the Six Sigma professional to significant conclusions. The 5 Phases of the Six Sigma Methodology is called as DMAIC or the Define Phase, Measure Phase, Analyze Phase, Improve Phase and the Control Phase. All the five phases are discussed below.
Define Phase
The goal of Define is to establish the projects foundation and is the most important aspect of the Six Sigma project. Projects start with a current state challenge which is articulated in a quantifiable manner as well as the goal to achieve, is also determined.
After specification of problems and goals the remaining tasks of valuation, team, scope, project planning, time line, stakeholders, VOC/ VOB etc. are to be completed. Various tools used by the Define Phase are
- Project Charter
- Problem Statement
- Business Case
- Objective
- High level time line
- Project Scope
- Project Team
- Stakeholder Assessment
- Pareto Charts
- SIPOC
- VOC/VOB and CTQ’s
- High Level Process Map
Measure Phase
In this phase baseline information is gathered about the process or product and achieve the following objectives
- Gather All possible x’s
- Analyze measurement system and Data Collection Requirements
- Validate Assumptions and Improvement Goals
- Determine COPQ
- Refine Process Understanding
- Determine Process Capability
- Process Stability
This Phase involves the usage of following tools
- Process Maps, Value Stream Mapping
- Failure Modes and Effects Analysis (FMEA)
- Cause and Effect Diagram
- XY Matrix
- Basic Control Charts
- Six Sigma Statistics
- Basic Statistics
- Descriptive Statistics
- Normal Distributions
- Graphical Analysis
- Measurement Systems Analysis
- Variable Gage R&R
- Attribute Gage R&R
- Gage Linearity and Accuracy
- Gage Stability
- Process Capability (Cpk, Ppk) and Sigma
- Data collection plan
Analyze Phase
It entails establishing verified drivers by using statistics and higher order analytics to discover the fact-based relationship between the process performance and the x’s or the root causes or drivers of improvement effort. Thus, resulting in establishment of hypothesis for improvements. This phase establishes transfer function Y=f(x) and validates list of critical X’s and their impacts. The analyze phase also results in a beta improvement plan like pilot plan. This phase utilizes various tools like
- Hypothesis Testing
- Simple Linear Regression
- Multiple Regression
Improve Phase
This phase is aimed only on making the improvement like improving the designing, testing and implementing of the solution. It involves enlisting statistically proven results from active study or pilot, creating the improvement plan, updating the stakeholder assessment, revising the business case with investment ROI, risk assessment and adding new process capability.
This phase uses tools like
- Design of Experiment (DOE)
- Implementation Plan
- Change Plan
- Communication Plan
Control Phase
It is the last phases of the Six Sigma methodology which establishes automated and managed mechanisms to maintain and sustain improvements in the process. A successful control plan also results in a reaction and mitigation plan with an accountability structure. It involves tools like control plan, training plans, poka-yoke and/or audit plans. The Six Sigma methodology is a complete system with tools and techniques built-in which ensures the Six Sigma practitioner to achieve success.
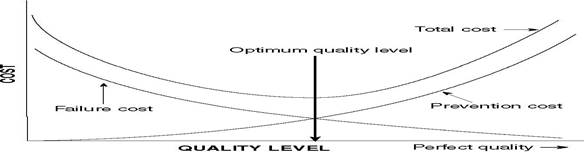
Cost of Quality (COQ)
Cost of quality is the sum of various costs as that of appraisal costs, prevention costs, external failure costs, and internal failure costs. It is generally believed that investing in prevention of failure will decrease the cost of quality as failure costs and appraisal costs will be reduced. Understanding cost of quality helps organizations to develop quality conformance as a useful strategic business tool that improves their product, services & brand image. This is vital in achieving the objectives of a successful organisation.
COQ is primarily used to understand, analyze & improve the quality performance. COQ can be used by shop floor personnel as well as a management measure. It can also be used as a standard measure to study an organization’s performance vis-à-vis another similar organisation and can be used as a benchmarking indices.
The various costs which constitute cost of quality are
- Appraisal cost is the cost incurred because of inspecting the processes. The cost associated with checking and testing to find out whether it has been done first time right.
- Prevention cost is the cost incurred because of carrying out activities to prevent failures. The cost associated with planning and training associated with doing it first time right.
- External failure cost is the cost incurred because of the failure that occurred when the customer used the product.
- Internal failure cost is the cost incurred because of the failures within the organization.
Examples of the various costs are
- Prevention – Training Programme, Preventive Maintenance
- Appraisal – Depreciation of Test/ Measuring Equipment, Inspection Contracts
- Internal Failure – Scrap, Rework, Downtime, Overtime
- External Failure – Warranty, Allowances, Customer Returns, Customer Complaints, Product Liability, Lawsuits, Lost Sales
Identifying COQ can have several benefits, as
- It provides a standard measure across the organisation & also inter-organisation
- It builds awareness of the importance of quality
- It identifies improvement opportunities
- Being a cost measure, it is useful at shop floor as well as at management level
Organizational Drivers and Metrics
Key Drivers
Performance measurement and analysis is the primary way to reduce wastages and maintain higher quality products or services. Various internal and external entities act as the key drivers for improvements. Internal key drivers include operational, workforce, governance and compliance performance, and the external key drivers include customer, service, competitive and financial performance.
Various performance measures are present but only those performance metrics need to be considered which represent the factors for improvisations in selected performances like financial or customer.
Voice of the Business
The Voice of the Business includes
- the board of directors
- stockholders in an organization
- the executives who run the company
- employees
- suppliers
- government mandates
- information technology and human relations requirements
- the operations part of the organization
- engineering and quality groups
There are important processes for capturing business requirements, or the Voice of the Business. This usually starts with a mission, vision, and objectives of the organization. You can leverage tools like Hoshin Kanri, policy deployment, or management by objectives. The focus is on elements like internal productivity and efficiency, which are often associated with value stream management and understanding the entire delivery of value across the end-to-end supply chain. This is influenced by a number of factors, including the need to meet requirements, and the need to implement continuous improvement.
Voice Of the Customer (VOC)
It is the term used to describe the stated and unstated needs or requirements of the customer. It helps in listing the relative importance of features and benefits associated with the product or service thus, showing the expectations and promises that are both fulfilled and unfulfilled by the product or service. Voice of the Customer (VOC) is describes customer’s feedback about their experiences with and expectations for the products or services.
This is about capturing customer requirements and meeting them. You need to collect a complete set of the customer’s needs, expressed in their own words. This reflects how the customer sees, uses, and interacts with outputs, and is prioritized based on importance to customer. This helps the organization remain relevant. It is the main motivator behind the implementation of Lean Six Sigma
Gathering VOC information can be done by
- Direct interviews of customers like site intercepts, personal interviews, focus groups, customer feedback forms, or structured online surveys.
- Indirect interviews with representatives like sales people or customer service representatives, who interface with the customer and report on their needs.
Conducting VOC helps by
- Customize products, services, add-ons and features to meet the needs and wants of customers
- No one becomes an industry leader without listening to the customer. Quality (customer perceived) is the leading driver of business success
- Maximize company’s profit. Higher market share companies have higher profits
CTQ Trees
Critical to Quality (CTQ) Trees, as shown in figure 1, below, are diagram-based tools that help you develop and deliver high quality products and services. You use them to translate broad customer needs into specific, actionable, measurable performance requirements.
For example, an instruction such as “improve customer service” is too broad to do much with. However, by using a CTQ Tree, you can drill-down from this broad goal to identify specific, measurable requirements that you can use to improve performance.
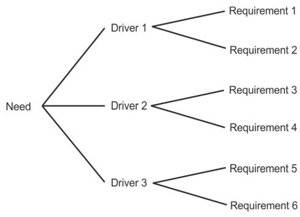
You use CTQ Trees by first identifying the critical needs of your customers. This is what your product or service must deliver for customers to be happy. For example, if you’re launching a new website, a need might be: “Must be accessible on a smartphone.”
Then, for each need, you identify its quality drivers. These are the factors that customers will use to evaluate the quality of your product. For example, for the need “Must be accessible on a smartphone,” a quality driver might be “Must display properly on smartphone web browsers.”
Finally, you identify measurable performance requirements that each driver must satisfy if you’re to actually provide a high quality product to your customers. Without these requirements, you have no way to actually measure the performance and quality of your product. For example, the measurable requirement for the driver, “Must display properly on smartphone web browsers,” might be for the website to “display as required on the five most popular smartphone web browsers.”
It is best to do a CTQ Tree for each individual critical need that you identify. You’ll then have a comprehensive list of requirements that you can use to deliver a product that delights your customers.
Kano Model
The Kano model is a theory of product development and customer satisfaction developed in the 1980s by Professor Noriaki Kano, which classifies customer preferences into five categories.
How does a company analyze customer needs? How can it easily determine what delights customers or what their basic needs are? One powerful technique to address these questions has been developed by Professor Noriaki Kano of Tokyo Rika University, and his colleagues. This is Kano’s theory: For some customer requirements, customer satisfaction is proportional to the extent to which the product or service is fully functional.
The main purpose of the Kano Model is:
- To communicate 5 universal categories of customer requirements that all product and service developers need to be aware of in order to remain competitive.
- To show how each of these 5 universal categories can influence satisfaction and dissatisfaction.
- To show how 2 of the categories add value and 2 of the categories detract from value, and 1 of the categories creates new value.
- To help organizations understand their customer needs better than their customers understand their own needs.
- To provide a mechanism to help organizations understand and classify all potential customer requirements or features into these 5 categories so they can prioritize development efforts on the things that most influence satisfaction and loyalty. This is done by the Kano Survey, or sometimes called a Kano Analysis.
The Kano model addresses the three types of requirements:
- Satisfying basic needs: Allows a company to get into the market.
- Satisfying performance needs: Allows a company to remain in the market.
- Satisfying excitement needs: Allows a company to excel, to be world class.
- Dissatisfiers or Basic Needs – Expected features or characteristics of a product or service (legible forms, correctly spelled name, basic functionality). These needs are typically “unspoken.” If these needs are not fulfilled, the customer will be extremely dissatisfied. An example of an “unspoken” need when staying at a hotel is cleanliness. This includes a clean bathroom, clean linens and a pleasant, fresh aroma in the air. When a person books a reservation at a hotel, they do not request a clean room. They expect it. If this basic need is not met, they will be extremely dissatisfied.
- Satisfiers or Performance Needs – Standard characteristics that increase or decrease satisfaction by their degree (cost/price, ease of use, speed). These needs are typically “spoken.” Using the hotel example again, “spoken” needs could be Internet access, a room away from the elevators, a non-smoking room, the corporate rate, etc.
- Delighters or Excitement Needs – Unexpected features or characteristics that impress customers and earn the company “extra credit.” These needs also are typically “unspoken.” Think of the Doubletree Hotels. Those who stay there are delighted by a freshly baked, chocolate chip cookie delivered to their room during turn-down service.
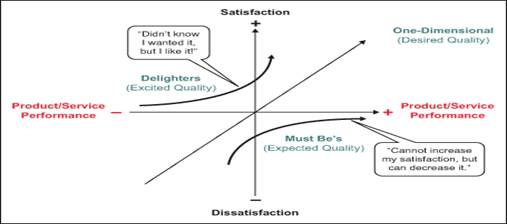
The horizontal axis of this figure indicates how fully functional a product/service is. The vertical axis indicates how satisfied the customer is. The line going through the origin at 45 degrees, represents the situation in which customer satisfaction is directly proportional to how fully functional the product/service is. In other words, it represents the situation in which the customer is more satisfied with a more fully functional product/service and less satisfied with a less functional product/service.
Kano terms such requirements as “one-dimensional” requirements. A 10 percent improvement in functionality results in a 10 percent improvement in customer satisfaction. For example, the faster the response time on a system, or the more miles per gallon for a vehicle, the more the customer likes it.
| Requirements Type | Definition |
| Must Be (Expected Quality) | Requirement that can dissatisfy (expected, but cannot increase satisfaction) |
| One-Dimensional (Desired Quality) | The more of these requirements that are met, the more a client is satisfied |
| Delighters (Excited Quality) | If the requirement is absent, it does not cause dissatisfaction, but it will delight clients if present |
| Indifferent | Client is indifferent to whether the feature is present or not |
| Reverse | Feature actually causes dissatisfaction |
Requirements can be identified as
The Balanced Scorecard
It is the most widely used business performance measurement framework, introduced by Robert S. Kaplan and David P. Norton in 1992. Balanced scorecards were initially focused on finding a way to report on leading indicators of a business’s health, they were refocused to measure the firm’s strategy that directly relate to the firm’s strategy. Usually the balanced scorecard is broken down into four sections, called perspectives, as
- The financial perspective – The strategy for growth, profitability and risk from the shareholder’s perspective. It focuses on the ability to provide financial profitability and stability for private organizations or cost-efficiency/effectiveness for public organizations.
- The customer perspective – The strategy for creating value and differentiation from the perspective of the customer. It focuses on the ability to provide quality goods and services, delivery effectiveness, and customer satisfaction
- The internal business perspective – The strategic priorities for various business processes that create customer and shareholder satisfaction. It aims for internal processes that lead to “financial” goals
- The learning and growth perspective – The priorities to create a climate that supports organizational change, innovation and growth. It targets the ability of employees, technology tools and effects of change to support organizational goals.
The Balanced Scorecard is needed due to various factors, as
- Focus on traditional financial accounting measures such as ROA, ROE, EPS gives misleading signals to executives with regards to quality and innovation. It is important to look at the means used to achieve outcomes such as ROA, not just focus on the outcomes themselves.
- Executive performance needs to be judged on success at meeting a mix of both financial and non-financial measures to effectively operate a business.
- Some non-financial measures are drivers of financial outcome measures which give managers more control to take corrective actions quickly.
- Too many measures, such as hundreds of possible cost accounting index measures, can confuse and distract an executive from focusing on important strategic priorities. The balanced scorecard disciplines an executive to focus on several important measures that drive the strategy.
Organizational Goals
Before a Six Sigma project can be executed, organizational strategic planning goals and objectives must be defined. Determining selection of appropriate projects and choosing an effective improvement model are crucial tasks that help to ensure company is pointed in the right direction.
The broad objectives of the organization must be aligned with its long term strategies. One of the techniques that an organization can use to align its objectives with long term strategies is ‘hoshin planning’. Hoshin planning helps an organization to develop its business plan and deploy the same across the organization in order to reach the set goals.
Priority Matrix
Priority matrixes are used to determine which projects should be chosen first using a scientific approach to identify what’s important and why it’s important. The priority matrix is made up of criteria, weight, score, and weighted score. The projects which should go first are chosen according to the scoring. You need to make note here that the scores are assigned using a scale of zero to ten. Zero is least favorable, and ten as most favorable. Then the weight for each criterion is multiplied by the score to get a weighted score for each of them.
The criteria in a priority matrix are sponsorship and top management support, projected benefits, resources, scope in terms of required returns, clarity of deliverables, time to complete, team membership requirements and process stability.
Strategy Map
A strategy map is a diagram that shows your organization’s strategy on a single page. It’s great for quickly communicating big-picture objectives to everyone in the company.
With a well-designed strategy map, every employee can know your overall strategy and where they fit in. It helps keep everyone on the same page, and it allows people to see how their jobs affect the company’s strategic objectives.
The main idea of a strategy map is that each strategic objective in your balanced scorecard is represented by a shape, usually oval. Very rarely are there more than 20 objectives. Tracking too many will dilute your overall message, making your strategy difficult to communicate.
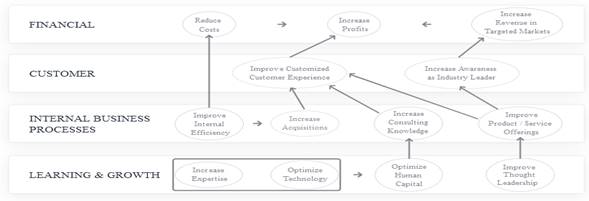
These objective ovals are then grouped into perspectives like “Financial” or “Learning and Growth.” Every organization is different, but most strategy maps have four perspectives, and they’re often similar to the ones shown here.
