To-do Lists
Managing time effectively is a basic function of project management, and good time management is a pre-requisite for all effective managers. One of the simplest way of managing time is to maintain a To-do list.
At times we are absorbed by endless tasks to perform in a day, and are unsure of how they all will get completed. It is quite easy to surrender to the burden of tasks but that is the time when one must try to jot down the list of tasks and thereby prioritize as per the requirement. When we get too busy, we end up feeling like we are barely able to keep our heads above water.
Some of the reasons for preparing To-DO list are,
- Organization your tasks – It is always suggested to organize your tasks with a list to make it look manageable and feel grounded. A clear picture of the finished and unfinished tasks helps you to be more organized and focused. A sense of progress is felt as the list of items are strike-off. Also it gives a sense of affirmation that you are going in the right direction and helps you to keep motivate
- External Memory – A To-do lists is a useful external memory that helps you to keep all the information intact and confirms that you will never lose anything that you have recorded on it. It is very crucial to maintain a to-do list as it allows to effortlessly keep track of the tasks to be performed. The to-do list helps to focus attention on the most important task of the moment.
- Motivation – A to-do lists is a great source of motivational tool when used for setting As we move further by completing the tasks on the list it gives a sense of confidence while crossing those items off your list. A to-do list makes you feel less stressed, more organized and leaves you with more time for other tasks.
Bar charts
Bar chart or bar graph is a chart with rectangular bars with lengths proportional to the values that they represent. These bars can either be plotted vertically or horizontally that are used to show comparisons among categories. One of the axis of the chart displays the specific categories being compared, and the other axis represents a discrete value. Note, some bar graphs displays bars clustered in groups of more than one (also known as grouped bar graphs), and others represents the bars divided into subparts to show cumulative effect (also known as stacked bar graphs). Vertical bar chart are also referred as column bar chart.
Features of Bar charts
- They have a discrete range.
- Bar chart can be arranged in any order.
- Bar charts arranged from highest to lowest incidence are known as Pareto charts.
- Bar graphs charts provide a visual presentation of categorical data.
- Bar graphs can also be used for more complex comparisons of data with grouped bar charts and stacked bar charts. For a grouped bar chart, for each categorical group there are two or more bars and the stacked bar chart stacks bars that represent different groups on top of each other.
- Bar graphs look more like a histogram, which record continuous data such that the bar graphs have spaces between columns and histograms do not have spaces, the difference is the type of data that each represent.
Flowchart
Flow charts are used to develop a process map which is a graphical representation of a process that displays the sequence of tasks with the help of flowcharting symbols. A flowchart represents the inputs, actions and outputs of a given system. Where,
- Inputs – Factors of production like land, materials, labor, equipment, and management.
- Actions – Method in which the inputs are processed and value is added to the product like procedures, handling, storage, transportation, and processing.
- Outputs – These are the finished good or delivered service given to the customer which includes undesirable entities like scrap, rework, pollution, etc.
Following are some standard flowchart symbols standardized by ANSI
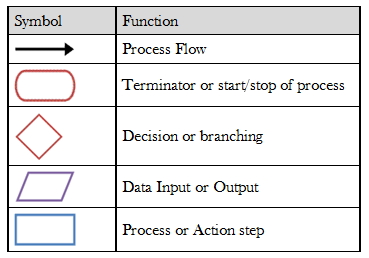
Flowchart displays a high-level view of a process view and it’s capability analysis. The flow chart can be made either more complex or less complex.
Critical Path Method (CPM)
Critical path method (CPM) involves breaking down complex projects into lists of activities, and thereby determining the activities that are critical to keep the project on schedule. In this case, critical path can be defined as a series of events, also called activities, that must be completed in the correct order and within the prescribed time frame. Critical path method is primarily based on mathematical calculations and used for scheduling project activities.
The calculation of critical path timing can be done manually, but it can be quite difficult due to the many interactions of activities. Therefore it is suggested to use a computer spreadsheet program. In short, CPM is a project network analysis technique that is used to predict total project duration. A critical path for a project is the series of activities that determines the earliest time by which the project can be completed where the critical path is the longest path through the network diagram having the least amount of slack or float.
Process of Developing CPM Report
- The process of developing CPM report starts with the use of assumptions, as a project typically has not started when the report is
- The process begins by listing all known activities from start to finish.
- Next the activities are given constraints if any exist, such as an earliest calendar date or the latest date to
- After assigning the fixed calendar constraints, all activities must be given an estimated duration to finish the job. Note, activity durations can also affect the critical path if they take longer than the estimated project time allows.
- Next step requires the critical path method software to determine how resources will be Where each activity can have a resource, a person or group, assigned to it which includes the resource name and the duration of the activity.
- Activities are then listed with an estimated cost of completion and any additional cost if the activity is delayed or extends past the due date
Note, any changes in the critical path resulting in delays or project extensions will have a visible effect on total project cost.
Generally, the commercial CPM software is used as it can easily show changes in the critical path for real-time activity data. So when an activity changes by date or duration, the project manager can input changes into the project schedule and immediately see the impact on total project and critical path schedules, available resources, and total costs. The critical path method provides the most accurate results by regularly providing inputs for a project as it continues, and changing activity dates and durations to actual dates and completion time of the activities.
Method of finding the Critical Path
- Develop an accurate project network diagram
- Add the durations for all activities on each path through the project network diagram
- Critical Path is the longest path in the network diagram
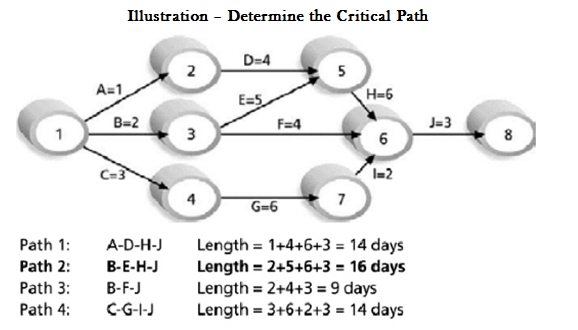
In the above illustration amongst the four possible paths, we choose the longest path as the critical path of the project using the network diagram
Therefore, Critical Path is B-E-H-J, with 16 days
Although many projects have only one critical path, but some projects may have more than one critical path depending on the logical flow of the project. If there is a delay in any of the activities under the critical path, there will surely be a delay in the project deliverables. In case such a delay occurs then project acceleration or re-sequencing is done in order to achieve the deadlines.
Key Steps in Critical Path Method
Process of using critical path method in project planning phase has six steps.
- Step 1: Activity specification: We can use the Work Breakdown Structure (WBS) to identify the activities involved in the project. This steps provides the main input for the critical path method. In the process of specifying activities, only the higher-level activities are selected for critical path method (else it becomes complex to maintain).
- Step 2: Establishing activity sequence: The second step involves arranging the activities in correct sequence. Therefore it becomes crucial to ask the following questions for each task in the
- Which tasks should take place before this task happens?
- Which tasks should be completed at the same time as this task?
- Which tasks should happen immediately after this task?
- Step 3: Network diagram: After the activity sequence is correctly identified, the network diagram can be drawn. There are a number of computer software, such as Primavera, for this purpose.
- Step 4: Estimates for each activity: In order to estimate the work, duration resources and cost for each task we can use a direct input from the WBS based estimation sheet. Many organisations use 3-point estimation method or COCOMO based (function points based) estimation methods for tasks estimation.
- Step 5: Identification of the critical path: Now in order to determine the critical path it is important to determine four parameters of each activity of the networke.,
- Earliest start time (ES): Earliest time an activity can start once the previous dependent activities are over.
- Earliest finish time (EF): Earliest start time + Activity duration.
- Latest finish time (LF): The latest time an activity can finish without delaying the project.
- Latest start time (LS): Latest Finish time -Activity duration.
- Float time: It is the time between the earliest (ES) and the latest (LS) start time or between the earliest (EF) and latest (LF) finish times. During the float time, an activity can be delayed without delaying the project finish date.
- Step 6: Project Progress using critical path diagram: The critical path diagram should be updated with actual values once the task is completed. It gives a fair view for the deadline and also helps to know whether they are able to meet the deliverables.
Critical Task
Critical tasks are the tasks that cannot be delayed without affecting the project finish date. Generally, many tasks have some slack and can therefore be postponed a bit without delaying other tasks or affecting the project completion date. So in case you wish to modify tasks to resolve over allocations, or adjust costs, or revise scope, ensure that the changes made to the critical tasks doe not impact the finish date of the project. Note, the critical tasks make up the schedule’s critical path.
When is a task said to be critical?
- It does not have any slack or float.
- It includes a Must Start On (MSO) or Must Finish On (MFO) date constraint.
- It includes a As Late As Possible (ALAP) constraint in a project scheduled from a start date.
- It includes a As Soon As Possible (ASAP) constraint in a project scheduled from a finish date.
- It has a finish date which is the either same or beyond the specified deadline date.
A task stops being critical when it’s completed, because it can no longer affect the completion of successor tasks or the project finish date.
Advantages of Critical Path Method
- It provides a visual representation of the project activities.
- It helps to presents the time to complete the tasks and the overall project.
- It helps in tracking of critical activities.
Program Evaluation and Review Technique (PERT)
Program Evaluation Review Technique also known as PERT is one of the network analysis technique that is used to estimate duration of the project duration when there is a high degree of uncertainty about the individual activity duration estimates. Under this technique probabilistic time estimates are used based on optimistic, most likely, and pessimistic estimates of activity durations.
PERT is one of the most widely used method for planning and coordinating large-scale projects. It is a road map for a particular program or project which identifies all major events together with their corresponding interactions. Often, the PERT charts are built from back to front since for most of the projects, the end date is fixed with the flexibility of molding the front-end. PERT-style planning involves identifying the critical activities on which others depend. The technique is often referred as PERT/CPM.
Network Diagrams
Network diagram is one of the chief feature of PERT analysis which provides a visual depiction of the major activities in the project and the sequence in which they must be taken-up. In which case activities are defined as suitable and distinct steps taken toward completion of the project. The network diagram primarily consists of arrows and nodes that can be arranged as per the requirement.
Key features of Network Diagram
- Arrows represent activities in the activity-on-arrow convention
- Nodes represent activities in the activity-on-node convention
- For each activity, the project managers provides an estimate of the time required to complete it.
- Sequence of activities leading from the starting point of the diagram to the finishing point of the diagram is called a path.
- Duration of each task involved in any path can be estimated by adding up the estimated times of all activities along that path.
- Path with the longest total time is then called the critical path.
Critical path is considered the most important part of the diagram as it helps to determine the completion date of the project. So in case of delay in completing event along the critical path leads to an extension of the final deadline for the project. Therefore if a manager wishes to reduce the time required to complete the project, then the focus must be on finding ways to reduce the time involved in activities along the critical path.
Type of time estimates for various activities
- Deterministic estimates: When time estimates can be made with a high degree of certainty.
- Probabilistic estimates: When time estimates are subject to variation. While using the probabilistic approach, managers provide three estimates for each activity – optimistic, pessimistic and most likely estimate.
PERT Analysis
A lot of information can be obtained by analyzing the network diagrams of projects as it displays the sequence of activities involved in a project. This sequence of activities helps to determine which activities must take place before others can begin, and which can occur independently of one another.
The project managers can also obtain valuable information by examining paths other than the critical path. As these paths require less time to complete, they can often allow some delay without affecting the project finish time. Here the difference between the length of a given path and the length of the critical path is known as slack. Once the slack is located it further helps the managers to allocate scarce resources and direct their efforts to better control other activities.
Large complex problems involving more than hundreds of activities, require the use of computers to create and analyze the project networks, where the project information input into the computer includes the earliest start time for each activity, earliest finish time for each activity, latest start time for each activity, and latest finish time for each activity without delaying the project completion.
Using these values, the computer algorithm helps to find the expected project duration and the activities located on the critical path. The project managers can use this information to find out the possibility of reducing the project time can using some additional resources, like labour or equipment. It is easy for the computer to generate the solution of the algorithm but the resulting information will only be as good as the estimates originally made. Therefore PERT analysis primarily depends on good estimates and at times by inspired guesses.
Advantages of PERT Analysis
- It forces to organize and quantify project information
- It provides with a graphic display of the project.
- It helps to identify activities that are critical to the project completion time
But the primary disadvantages of PERT lies in the nature of reality. A project with complex systems and plans, involving many suppliers and channels of supply, make it very difficult to predict precisely the next event. PERT analysis only works best in a identified engineering projects with good experience to predict tasks accurately in advance.
