A process is a group of resources and activities which processes inputs into outputs by value addition by executing repeatable tasks in a specific order. These activities and resource inputs at least for crucial process should be documented and controlled.
Flow charts, process maps, written procedures and work instructions are tools used for process modeling and documentation.
Process maps and flowcharts are often used interchangeably, although they are not exactly the same thing. A flowchart is the diagram itself, while process mapping involves the flowchart being used to map a process in order to identify the waste, and the non-value-added activities in a process.
Process Mapping
It depicts a process in schematic format thus providing the ability to visualize the process under review. Process mapping is similar to flow charting, as it describes a process with symbols, arrows and words thus avoiding explanations. Process maps are used to outline new procedures and review old procedures for improvements. Many symbols used are standardized under ANSI Y15.3. Process maps are usually used to analyze and document top-level processes.
Process mapping consists of different kinds of maps
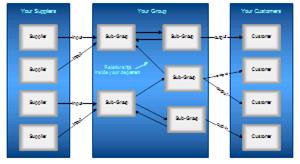
- Relationship Maps show the overall view. They show the departments of an organization and how they interact with suppliers and customers.
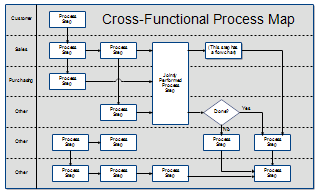
- Cross-functional Maps or Swim Lane Charts show which department performs each step and the inputs and outputs of each step. These maps have more detail than a relationship map but less than a flowchart.
Process maps may also contain actions which cause delays or bottlenecks – like a review or rework loop and include the following
- Workflow diagrams – Workflow diagrams support process maps and are called spaghetti diagrams in the practice of Lean. Workflow diagrams are extremely helpful determining the number of steps in a process, the degree and amount of movement involved, as well as the locations of the tasks, actors, and people working in a process. The technique is to get a two-scale drawing or blueprint of a process and pretend you’re it. Record the first thing that happens – that’s step one. Then follow the process and walk through to what or who gets it next using lines to illustrate the motion in physical space between steps in a process. Place numbers in the various relevant spaces on the floor chart, where each number represents a step. Link the steps by way of arrows which indicate the order of the steps.
- Top-down chart – A top-down chart is a valuable source of information that can be used in conjunction with a process map. You need to understand the major steps you took in your process mapping and in your workflow diagram, then get additional data to go with it. For example, a top-down chart may detail five steps of a sales process. Each step would display as a column heading and each column would contain subsequent steps of the sales process in the rows below the relevant headings.
- Functional deployment map – A functional deployment map helps you understand the potential activities and problems that you could find. Try to understand where your inputs, outputs and other actions are in the process, then do some analysis to further your understanding. For example, consider a functional deployment map that has two columns and four rows. The first column contains rows of individuals responsible for functions of a sales process – each row is referred to as a swim lane. The second column contains a flow chart. If an individual is responsible for certain steps in the sales process, the flow chart displays the steps in the swim lane for that individual. Wherever there is a handover in responsibility for a step, there is a change in direction of the flow between swim lanes.
