A process is a group of resources and activities which processes inputs into outputs by value addition by executing repeatable tasks in a specific order. These activities and resource inputs at least for crucial process should be documented and controlled.
Process Modeling
Flow charts, process maps, written procedures and work instructions are tools used for process modeling and documentation.
Flow Charts
Flowcharts and process mapping are powerful tools used to depict the flow of activities in a process. These tools help show many different things including process boundaries, and responsibilities for the work to be done. These tools also show interactions between the steps, and possible disconnects. Where there are activities that are not connected to something else, it needs to be addressed. This assists in understanding and highlighting the non-value-add activities to figure out where bottlenecks are. This is helpful in distinguishing important inputs and outputs of the process.
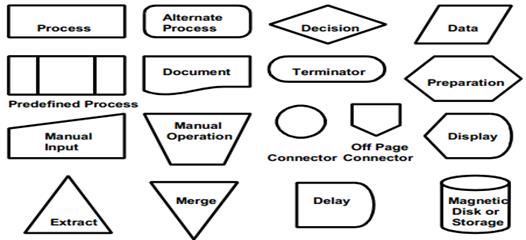
A flow chart or process map is a simple graphical tool for documenting the process flow which is comprehensible to users as it depicts the process sequence. A flow chart examines each step in detail as each task is represented by a symbol. ANSI standards are present which lists various symbol types used for representation in a flowchart. Flowchart helps in improvement identification and can compare the present process to the desired process. Diamond shaped symbol are used for decision with only two outcomes (yes or no).
Building a flowchart is very much a team sport and when you think about chartering a Lean Six Sigma kind of project, you typically want to have customers, your subject matter experts who do the work, and maybe your suppliers as well, and have a lot of people involved. The moment you want to capture is the what, the when, and the where of the entire end-to-end process.
Common flow chart symbols are
There are four steps in building a flowchart:
- Define the process boundaries ─ There are lots of ways to define the process boundaries and generally you are going to want to pick a logical start and stop point. You want to understand the steps that fall within any relatively controllable or noble process scope; where does it begin, where does it end. You want to resist the temptation to bite off more than you can chew.
- List the steps in order – Next you will want to consult those involved. These are the folks that actually know about the process and can provide inputs and suggestions, about how the process works and where you might improve it. What generally would start at a fairly high level and define the major tasks and identify the major decision points. From there you can break things down and make the connections between the steps.
- Create the flowchart with symbols.
- Verify and improve the process flow – Show the flowchart to the stakeholders, and the parties required to carry out the steps so that they can understand the process. Make the necessary changes and improvements to the process.
Process Mapping
It depicts a process in schematic format thus providing the ability to visualize the process under review. Process mapping is similar to flow charting, as it describes a process with symbols, arrows and words thus avoiding explanations. Process maps are used to outline new procedures and review old procedures for improvements. Many symbols used are standardized under ANSI Y15.3. Process maps are usually used to analyze and document top-level processes.
Process mapping consists of different kinds of maps
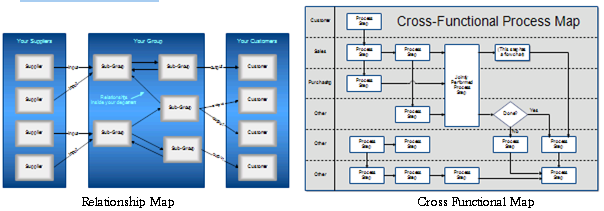
- Relationship Maps show the overall view. They show the departments of an organization and how they interact with suppliers and customers.
- Cross-functional Maps or Swim Lane Charts show which department performs each step and the inputs and outputs of each step. These maps have more detail than a relationship map but less than a flowchart.
Process maps may also contain actions which cause delays or bottlenecks – like a review or rework loop and include the following
- Workflow diagrams – Workflow diagrams support process maps and are called spaghetti diagrams in the practice of Lean. Workflow diagrams are extremely helpful determining the number of steps in a process, the degree and amount of movement involved, as well as the locations of the tasks, actors, and people working in a process. The technique is to get a two-scale drawing or blueprint of a process and pretend you’re it. Record the first thing that happens – that’s step one. Then follow the process and walk through to what or who gets it next using lines to illustrate the motion in physical space between steps in a process. Place numbers in the various relevant spaces on the floor chart, where each number represents a step. Link the steps by way of arrows which indicate the order of the steps.
- Top-down chart – A top-down chart is a valuable source of information that can be used in conjunction with a process map. You need to understand the major steps you took in your process mapping and in your workflow diagram, then get additional data to go with it. For example, a top-down chart may detail five steps of a sales process. Each step would display as a column heading and each column would contain subsequent steps of the sales process in the rows below the relevant headings.
- Functional deployment map – A functional deployment map helps you understand the potential activities and problems that you could find. Try to understand where your inputs, outputs and other actions are in the process, then do some analysis to further your understanding. For example, consider a functional deployment map that has two columns and four rows. The first column contains rows of individuals responsible for functions of a sales process – each row is referred to as a swim lane. The second column contains a flow chart. If an individual is responsible for certain steps in the sales process, the flow chart displays the steps in the swim lane for that individual. Wherever there is a handover in responsibility for a step, there is a change in direction of the flow between swim lanes.
Written Procedures – Written procedures helps in standardizing the processes thus also enabling improvement avenues for the process. Written procedures are developed by process owners or those responsible for the process. Written procedures are used for explaining complex or lengthy processes or for routine complex tasks thus, making them crucial for being consistent. Development of written procedures is needed for being comprehensible to the user.
Documenting the process in the form of a procedure facilitates consistency in the process and avoids mistakes. Written procedure describes the process at a general level whereas, written instructions are more specific.
Work Instructions – Written instructions are list or sequence of steps to be undertaken usually by the operational staff for accomplishing a specific task. These instructions are specific to a task which is usually routine. It enlists step-by-step sequence of activities. Flow charts may also be used with work instructions to show relationships of process steps. Controlled copies of work instructions are kept in the area where the activities are performed.
Process Inputs and Outputs
Before a process can be improved, it must first be measured. This is accomplished by identifying process input variables and process output variables, and documenting their relationships through cause and effect diagrams, SIPOC and other similar tools. Inputs (Xs) are causes which are independent variables which results in specific outputs (Ys) or effects which are dependent variables. Thus, process maps are expanded to cover customer and supplier by SIPOC to gather measurable data from all.
Before you begin to make changes to a Lean Six Sigma project, it is important to understand the process and its importance. You need to understand the cause and effect of the various process steps, and recognize how everything is affected. Business processes are typically a series of events that produce a given output, and more often than not are defined by numerous steps in the end-to-end process.
Inputs – It’s important that your team clearly understands the relationship between the inputs, the process, and the outputs. Inside the process you have many X factors that together end up dictating the amount of variability, the quality, and the repeatability of your output Y factor. The variables on the outputs can be many things including, for example, context and response time, the order to delivery time for a custom bicycle, a loan approval cycle, or a visit to the doctor. You need to recognize that outputs for any end-to-end process can in turn become inputs to a subsequent or downstream process later on.
Process Boundaries – Process boundaries and dictating what those are is an important aspect of defining the project and where you are going to focus your efforts. There are transition points between each of the steps. You need to understand where you transition from one functional process to another. For example, with a manufacturing company, you could have process boundaries starting with ordering an aircraft part. And that could begin with the receipt of the order at the company and then we would have the various operations that would occur down to the inspection of that part, pass/fail. And if it’s good, you can ship it to the customer. If it fails, you’d rework it and pass it back through.
Process swim lane diagrams – Process swim lane diagrams are a powerful way to visualize and understand a complex process. The swim lane diagram is a process flow diagram that helps you understand and break down the various actors, actions, and flow of time for a process. There are a number of actors that are represented in this type of diagram. Each of these actors performs various actions. These actions are connected to other actions further down the process, until the process is finally complete.
Cause and Effect (Fishbone) Diagrams – They are also called as Ishikawa diagrams and have been discussed earlier. They break problems down into small-size pieces and displays possible causes in a graphical manner. They display how various causes interact with each other and uses brainstorming rules when generating ideas. A fishbone diagram development consists of brainstorming, prioritizing and development of an action plan.
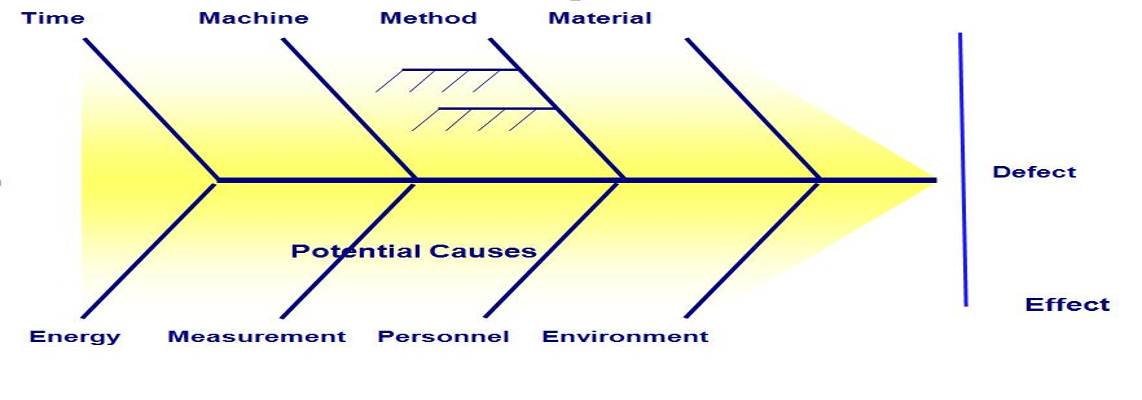
It highlights potential causes of a particular problem or the effect. During measure phase, it is used to brainstorm potential x data. The selected CTQ or CTP are placed in the head of the fish. Each bone is labeled with categories which usually are people, machine, materials, environment and methods. Each category is reviewed by the team by brainstorming for input and process data to collect. The development of fishbone diagram in measure phase involves, review of process maps developed in define phase, review of categories, putting CTQ or CTP in the head of the fish, brainstorming and reviewing the diagram with revision as needed.
SIPOC – SIPOC stands for Suppliers-Inputs-Process-Outputs-Customers and has been discussed earlier. SIPOC addresses issues regarding the input, output, supplier and customers like output being produced by the process, who provide inputs to this process, what are the inputs, what resources does this process use, which steps add value, etc. These issues apply to all processes and SIPOC addresses by putting in place a standard format.
SIPOC development is initiated with persons having knowledge of the process and then conducting a brainstorming session to describe the problems and garner consensus for resolution.
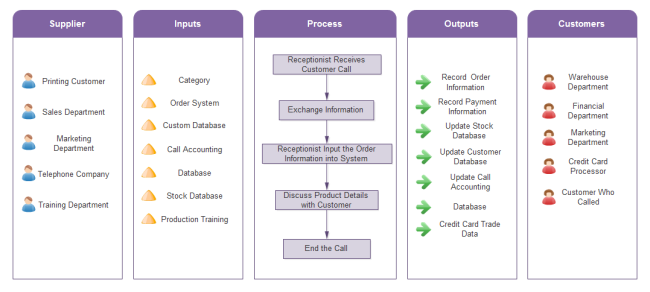
Example – A catalogue retail company call center use this SIPOC diagram to define the scope of the process, including: the start and end of the process, the major steps, the primary inputs and outputs, and the key customers and suppliers. With this simple yet comprehensive picture at hand, every staff or member involved in this activity will have a deep and clear understanding of this process.
As it’s a high-level picture, it won’t include many details. The major steps on process part will be limited to less than 7. Usually a flowchart with arrow connectors showing the sequence can best present the steps. In this example, five steps are used to illustrate the main procedure.
Development of SIPOC involves identifying the process steps then, identifying the outputs of the process followed by the customers receiving the outputs of the process, then the inputs and the supplies of the required inputs.
SIPOC Elements – It’s important to recognize the different factors as you work through the SIPOC diagramming process. These can be captured as a spreadsheet or a flipchart. For many service processes, the customer actually makes a request as an input to your process, so they are in essence a supplier. Then you do a value-add activity, give the customer the output, and they receive it in the end.
Inputs can be raw materials, instructions, data, drawings, specifications, quality requirements, standard operating procedures, labor, resources, machines, and equipment used throughout the entire process. The process itself can take a variety of forms such as a value stream map, a process map, or a swim lane chart. You need to recognize that outputs, or Y values, that you’re trying to accomplish are products of the various actions that take place during the process. The function of the X factors in the process is to give you the quality of the output that you’re looking for at the end of the process.
An output can take many forms, such as a value-add task completion that’s ready for the downstream step, a report, a product, a part, or an assembly. It could be a new specification you’re going to use, a certification that your customer requires, a check to send to the customer, or an approval or a permit that you’re issuing.
The last element is the customer. The customer defines the key features and functions, what is appealing, and the top issues. You use that information to seek out root cause analysis and work upstream to make sure your process is delivering optimal results.
