It is an estimate of an interval in which future observations will fall, with a certain probability, given what has already been observed.
A prediction interval bears the same relationship to a future observation that a frequent confidence interval bears to an unobservable population parameter: prediction intervals predict the distribution of individual future points, whereas confidence intervals and credible intervals of parameters predict the distribution of estimates of the true population mean or other quantity of interest that cannot be observed. Prediction intervals are also present in forecasts. It is difficult to estimate the prediction intervals of forecasts that have contrary series.
Prediction Intervals represent the uncertainty of predicting the value of a single future observation or a fixed number of multiple future observations from a population based on the distribution or scatter of a number of previous observations. Similar to the confidence interval, prediction intervals calculated from a single sample should not be interpreted to mean that a specified percentage of future observations will always be contained within the interval; rather a prediction interval should be interpreted to mean that when calculated for a number of successive samples from the same population, a prediction interval will contain a future observation a specified percentage of the time.
Plot of upper and lower prediction interval bounds for 20 samples each consisting of 10 pH measurements drawn from the same population. The plot also includes 20 individual future observations. Notice that 1 out of the 20 single future pH readings (circled in red) is outside of the associated prediction interval region. This is in alignment with the 5% of intervals not expected to contain a single future observation for a confidence level of 95%.
Prediction intervals are most commonly used in regression statistics, but may also be used with normally distributed data. Calculation of a prediction interval for normally distributed data is much simpler than that required for regressed data, so we will start there.
Prediction Interval for Normal Data
The formula for a prediction interval is nearly identical to the formula used to calculate a confidence interval. Recall that the formula for a two-sided confidence interval is
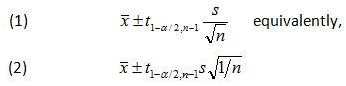
where is the sample average, s is the sample standard deviation, n is the sample size, 1-a is the desired confidence level, and is the 100(1-a/2) percentile of the student’s t distribution with n-1 degrees of freedom.
All that is needed for a formula to calculate a prediction interval is to add an extra term to account for the variability of a single observation about the mean. This variability is accounted for by adding 1 to the 1/n term under the square root symbol in Eq 2. Doing so yields the prediction interval formula for normally distributed data
![]()
As an example, let’s again take a look at the pH example
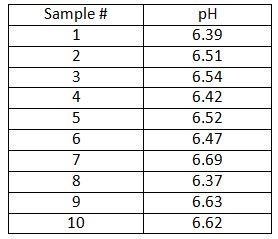
The analyst wants to know, based on the samples collected so far, the two-sided interval within which a single future pH observation is likely to lie with some level of confidence. The average pH,, in this example is 6.52; the sample standard deviation, s, is 0.11. The confidence level chosen is 95% (a=0.05)
Prediction intervals provide a means for quantifying the uncertainty of a single future observation from a population provided the underlying distribution is normal. Prediction intervals can be created for normally distributed data, but are best suited for quantifying the uncertainty associated with a predicted response in linear regression statistics.
