A hypothesis is a theory about the relationships between variables. Statistical analysis is used to determine if the observed differences between two or more samples are due to random chance or to true differences in the samples.
Basics
A hypothesis is a value judgment, a statement based on an opinion about a population. It is developed to make an inference about that population. Based on experience, a design engineer can make a hypothesis about the performance or qualities of the products she is about to produce, but the validity of that hypothesis must be ascertained to confirm that the products are produced to the customer’s specifications. A test must be conducted to determine if the empirical evidence does support the hypothesis.
Hypothesis testing involves
- drawing conclusions about a population based on sample data
- testing claims about a population parameter
- providing evidence to support an opinion
- checking for statistical significance
A hypothesis could center around the effect on customer satisfaction if you dramatically improve the time to answer calls from people who are calling for assistance, as well as the amount of time it takes to provide a quality answer right the first time.
There are two categories of hypothesis testing –
- Descriptive – Descriptive hypotheses concern what you can physically measure about a variable like size, form, etc For example, it could center around your capability to control the wall thickness of a plastic pipe very tightly throughout the entire circumference, for example, and the effect that might have on the weight per foot of pipe.
- Relational – It involves testing whether the relationship between variables is positive, negative, greater than a given value, or less than a given value. A relational hypothesis could center around the effect on customer satisfaction if you dramatically improve the time to answer calls from people who are calling for assistance, for example, as well as the amount of time it takes to provide a quality answer right the first time.
Hypothesis tests include – the 1-sample hypothesis test for means and the 2-sample hypothesis test for means. In a distribution graph, the 1-sample test has a single mean, which falls to the left of the industry standard. The 2-sample test has two separate mean values. Other types of hypothesis tests include the paired t-test, a test for proportions, a test for variances, and ANOVA, or analysis of variances.
In the paired t-test, for example, you use two sample means to prove or disprove a hypothesis about two different populations. For example, maybe you’re thinking about your test in a customer contact center and if you would find a relationship between the handle-time for the call based on the experience of the technician. You might expect to see a big difference in how long it takes if they have six weeks of training versus six years of experience.
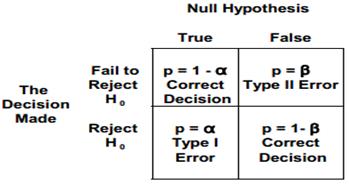
Type I error (False Positive) – It occurs when one rejects the null hypothesis when it is true. The probability of a type I error is the level of significance of the test of hypothesis, and is denoted by *alpha*. An example of a type I error is the notion of producer’s risk. Concluding that something’s bad when it’s actually good is a form of type I error. Other common types of type I errors could be a false alarm, false negative, or an error with the alpha factor or constant that you’re using in your calculations. The alpha or the constant risk is the risk you’re willing to take in rejecting the null hypothesis, when it’s actually true. The common alpha value in most cases is 0.05, giving you a 95% confidence level. What you’re testing for is the possibility of committing a type I error. Usually a one-tailed test of hypothesis is used when one talks about type I error or alpha error.
The alpha significance level signifies that degree or risk of failure that’s acceptable to you. It helps you decide if the null hypothesis can be rejected. Then you have the balance of this and it’s a factor of 1 – α. This is your confidence level acceptance region. This signifies the level of insurance that you expect for the results of the data being studied. It describes the uncertainty associated with the actual sampling method that you’re using.
In a typical distribution curve, a small section of the curve to the left of the peak is the alpha significance level rejection region. The remaining, larger section of the curve is the 1 – α confidence level acceptance region.
Type II error (False Negative) – It occurs when one rejects the alternative hypothesis (fails to reject the null hypothesis) when the alternative hypothesis is true. The probability of a type II error is denoted by *beta*. One cannot evaluate the probability of a type II error when the alternative hypothesis is of the form µ > 180, but often the alternative hypothesis is a competing hypothesis of the form: the mean of the alternative population is 300 with a standard deviation of 30, in which case one can calculate the probability of a type II error.
A type II error relates to beta (β), which is the effect that you’re looking for. You’re looking for the risk associated with the effect of what you’re studying in your dataset.
The most commonly used beta risk is a value of 0.10. An example is, quality assurance risk of failing to find the defective piece during the quality check. It is also called consumer’s risk. Other might also be misdetection, a false positive, or the effect error associated with your data.
Alpha and the beta factors are inversely proportional; reducing the alpha increases the beta, and vice versa.
Practical Significance – Practical significance is the amount of difference, change or improvement that will add practical, economic or technical value to an organization.
Statistical Significance – Statistical significance is the magnitude of difference or change required to distinguish between a true difference, change or improvement and one that could have occurred by chance. The larger the sample size, the more likely the observed difference is close to the actual difference.
In testing, you must have statistical significance. It’s the only way to guarantee the strength of your results and support your decisions. In business, though, you also need to have practical significance to back up the decisions you make.
Statistical significance ensures that your results are not by chance; the purpose of your data is to support this theory. Determining statistical significance adds strength to the decisions you make, based on those results. Practical significance is necessary when the real-world elements, such as cost or time, come into play. Decisions can’t be made solely on statistical significance.
Practical significance should be considered when setting an α level for statistical significance. You want to find a balance so you don’t find that your results are practically, but not statistically, significant. And just because results are statistically significant doesn’t mean they’re practically significant.
Null Hypothesis – The first step consists in stating the hypothesis. It is denoted by H0, and is read “H sub zero.” The statement will be written as H0: µ = 20%. A null hypothesis assumes no difference exists between or among the parameters being tested and is often the opposite of what is hoped to be proven through the testing. The null hypothesis is typically represented by the symbol Ho. It expresses the status quo, or “what they say.” It assumes that any observed differences are due to chance or random variation. It can also sometimes be expressed with less than or equal to (≤) or greater than or equal to (≥). It also uses the operator equals (=).
Alternate Hypothesis – If the hypothesis is not rejected, exactly 20 percent of the defects will actually be traced to the CPU socket. But if enough evidence is statistically provided that the null hypothesis is untrue, an alternate hypothesis should be assumed to be true. That alternate hypothesis, denoted H1, tells what should be concluded if H0 is rejected. H1 : µ ≠ 20%. An alternate hypothesis assumes that at least one difference exists between or among the parameters being tested. This hypothesis is typically represented by the symbol Ha. It is what you want to test or prove. This assumes that the observed differences are real and not due to chance or random variation. It uses the operators not equal to (≠), greater than (>), and less than (<).
Establishing hypotheses – As you move into establishing your hypothesis, you’ll start with the null hypothesis, represented by H₀. What you’re looking for here is whether the population parameters of interest are equal and there’s really no change or difference. For example, you might have a null hypothesis that humidity would not have an effect on the weight of parts as you’re measuring the weight of parts in a process.
The alternative hypothesis, represented by Hₐ, looks at the population parameters of interest that are not equal, and the difference is real. For example, your hypothesis might be that the greater the level of the experience of your workers would directly correlate to the quality of the output of the work itself or your expectation that men and women would react differently to a change in food ingredients in a product.
A hypothesis test has one of two possible outcomes:
- reject the null in favor of proving that there is an alternative hypothesis – You need to find out if the result is statistically significant to disprove your hypothesis. For example, does it matter which country people live in with respect to the customer satisfaction level for a given level of service? You’re expecting to find a null, but you could reject it in favor of the alternative hypothesis if you find out that people from different countries have different opinions about the same service level.
- fail to reject the null hypothesis – In this case, you find insufficient evidence to claim that your null hypothesis was invalid or that an alternative hypothesis is true. For example, when exploring whether ambient humidity in the air affects a plastic product weight over time, you’re expecting to find a yes and you actually do. This would be the alternative hypothesis rejecting it.
The correct way to state the result of the test is to do it in terms of the null hypothesis. For example, state the result as either “we reject the null hypothesis” or “we fail to reject the null hypothesis.”
Test Statistic – The decision made on whether to reject H0 or fail to reject it depends on the information provided by the sample taken from the population being studied. The objective here is to generate a single number that will be compared to H0 for rejection. That number is called the test statistic. To test the mean µ, the Z formula is used when the sample sizes are greater than 30,

and the t formula is used when the samples are smaller,

The level of risk – It addresses the risk of failing to reject a hypothesis when it is actually false, or rejecting a hypothesis when it is actually true.
Testing for a Population Mean – When the sample size is greater than 30 and σ is known, the Z formula can be used to test a null hypothesis about the mean. The Z formula is as

Phrasing – In hypothesis testing, the phrase “to accept” the null hypothesis is not typically used. In statistical terms, the Six Sigma Black Belt can reject the null hypothesis, thus accepting the alternate hypothesis, or fail to reject the null hypothesis. This phrasing is similar to jury’s stating that the defendant is not guilty, not that the defendant is innocent.
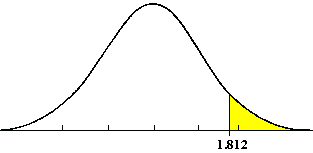
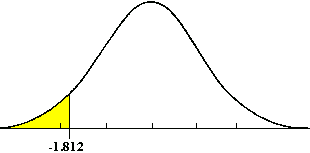
One Tail Test – In a one-tailed t-test, all the area associated with a is placed in either one tail or the other. Selection of the tail depends upon which direction to bs would be (+ or -) if the results of the experiment came out as expected. The selection of the tail must be made before the experiment is conducted and analyzed.
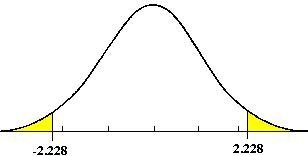
Two Tail Test – If a null hypothesis is established to test whether a population shift has occurred, in either direction, then a two tail test is required. The allowable a error is generally divided into two equal parts.
A hypothesis test may be one-tailed or two-tailed, as follows:
- if your alternative hypothesis is “The mean is going to be greater than the hypothesis mean”, you would find a one-tailed test to the right
- if your hypothesis is “The hypothesis mean is going to be greater than the mean”, you would have a one-tailed test to the left
- if your alternative hypothesis is “The mean would not be equal”, you would have a two-tailed test with defects on both sides of the data curve
