A HR KPI dashboard is an advanced analytics tool that displays important HR metrics using interactive data visualizations. It helps the HR department to improve recruiting processes, optimize the workplace management as well as to enhance the overall employee performance.
A useful HR dashboard is concise and has an intuitive display of KPIs that is understandable, shareable, and actionable.
Dashboards are also an efficient way to communicate with staff and stay abreast of what’s happening in your company. Here’s an example of what a clear and functional HR dashboard — in this case dedicated to employee performance functions — can look like
Dashboard Types
Dashboards are often classified as strategic, analytical, or operational. Many dashboards are hybrids combining these types.
- Operational: Operational dashboards provide real-time alerts to any deviations from the norm. Professionals use this type of dashboard to monitor and analyze a company’s activities in a specific business area. Generally, departmental employees use operational dashboards often to highlight issues in real-time so they can correct a situation.
- Strategic Dashboards: Also known as executive dashboards, this type of dashboard provides an overview of the data executives need to ascertain the health of the a department or the entire organization and identify opportunities for improvement.
- Analytical: To understand trends and underlying causes, and compare variables and timeframes, users often rely on analytical dashboards. Analytical dashboards are more detailed than the other two dashboard types, and hold both operational and strategic data. They offer drill-down functionality to enable data exploration and gain insights from multiple sources.
HR KPI Dashboards Benefits
HR dashboards add value by measuring progress and provide multiple benefits, as
- Monitoring and Management: Regular reporting enables HR to accurately take the pulse of the organization by tracking key workforce metrics.
- Drill-Down Ability: Dig into data to uncover the root causes of issues like high turnover in specific departments pr the cost of hiring for particular positions
- Data-Driven Decision Making: Spot trends and understand challenges and opportunities — based on real data.
- Improved Hiring Processes: recruitment analytics saves time and money by taking informed talent decisions or assess employees’ performance more objectively.
- Onboarding: Improve retention and productivity with an onboarding process strengthened by dashboards. Track the delivery of electronic documents, new hire orientation and compliance processes, and job-specific training.
- Engagement and Motivation: Dashboard can help build thriving teams and culture by understanding commitment and dedication of team members by sensing organizational sentiment.
- Retention: HR department can easily visualize and analyze shortfalls in workforce planning, hiring, and onboarding practices.
Guidelines for a good HR dashboard
- Narrow down what you measure. Just because you can monitor dozens of KPIs doesn’t mean you should. You’re not building Frankenstein’s monster. You’re painting a nuanced picture of the workforce that guides the decision making process. Monitor the metrics that benchmark performance. Stick to the eight to 12 most important visualizations and drill down as necessary.
- Only measure meaningful data. The most valuable data is actionable. The goal is to monitor metrics which can be linked to a future course of action. Let’s say HR needs to meet aggressive hiring deadlines due to the company’s rapid growth. If your all of your top performing employees were found through LinkedIn ads, then should you spend time and money sourcing new candidates at job fairs? Only monitor data from which you can glean insights for decisions.
- Dive deeper. Businesses must strike a delicate balance between measuring everything and measuring nothing. To do this, first pinpoint the challenges of each department. Next, determine which are related to HR. Then determine what metrics would provide insight into these challenges.
- Automate your HR dashboard: Don’t try to generate every dashboard manually. This is highly inefficient and will drain the capacity of your HR data department.
- Provide relevant information: Don’t try to make everyone happy. If you can make 80% of the people happy with 20% of the information, that may well be the best solution. Making an overly complicated dashboard and dashboard on irrelevant data may lead to low engagement with the dashboards or dashboards and thus lower the impact.
- Fix mistakes: HR data is dirty, and there will be mistakes in your HR dashboard. Fix those mistakes in the source systems and make sure to help to create procedures that are beneficial in the accurate input of data.
Sample HR KPI Dashboards
As part of the development of the HR Dashboard we collated the most frequently used HR KPI measures and categorized them under the following five headings:
- Recruitment: Average Lead Time to Recruit New Employees, Performance Score of New Employees within six months, Average length of placement in months for the manager, Diversity (Female to Male Ratio)
- Training & Development: Training Hours per Employee / Year, % Change of Productivity Before/After the Training, Employee satisfaction points with training
- Performance & Career Management: % of employees that fully execute their Individual Development Plan, % of employees that participate Career coaching plan, Average time employees are in the same function
- Employee Retention & Productivity: % of employees who leave the company in a given time period, Profit per Employee, Average headcount of employees each human resources (HR) employee caring for, Average number of vacation days per employee, Total overtime hours as a percentage of all work hours, Average salary, Average retirement age, Total overtime hours as a percentage of all work hours
- Budget Metrics: Actual vs Budgeted Hire, Percentage of HR budget spent on training, Average training costs per employee
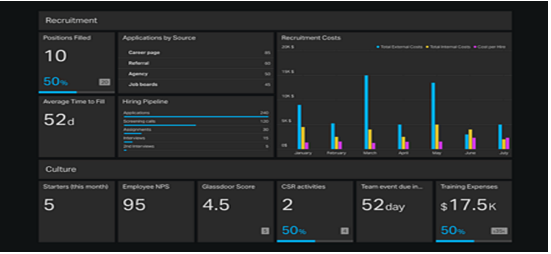
Sample Recruitment Dashboard
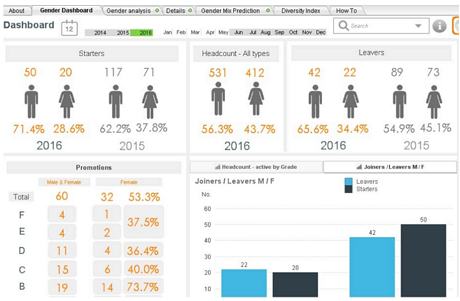
Sample Diversity Dashboard
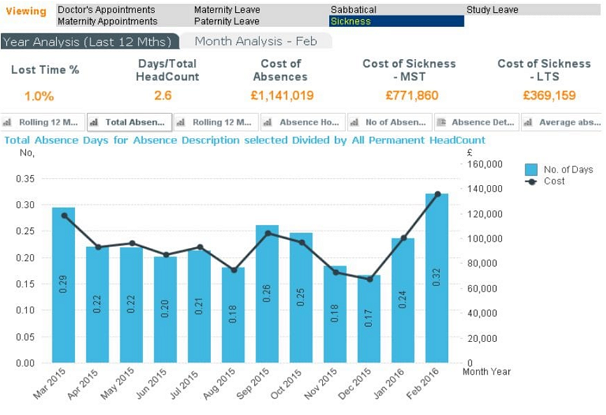
Sample Sickness and Absence Dashboard