Types of data
There are two types of data – discrete or continuous.
- Attribute or discrete data – It is based on counting like the number of processing errors, the count of customer complaints, etc. It can only be counted in whole numbers. Sometimes data collection priority will be to identify where the information is originating. This type of data is called locational data. It is plotted on a defect-by-location check sheet. Discrete data values can only be non-negative integers such as 1, 2, 3, etc. and can be expressed as a proportion or percent (e.g., percent of x, percent good, percent bad). It includes
- Count or percentage – It counts of errors or % of output with errors.
- Binomial data – Data can have only one of two values like yes/no or pass/fail.
- Attribute-Nominal – The “data” are names or labels. Like in a company, Dept A, Dept B, Dept C or in a shop: Machine 1, Machine 2, Machine 3
- Attribute-Ordinal – The names or labels represent some value inherent in the object or item (so there is an order to the labels) like on performance – excellent, very good, good, fair, poor or tastes – mild, hot, very hot
- Variable or continuous data – They are measured on a continuum or scale and can be meaningfully subdivided into finer and finer increments. Data values for continuous data can be any real number: 2, 3.4691, -14.21, etc. Continuous data can be recorded at many different points and are typically physical measurements like volume, length, size, width, time, temperature, cost, etc. It is more powerful than attribute as it is more precise due to decimal places which indicate accuracy levels and specificity. It is any variable measured on a continuum or scale that can be infinitely divided.
Measurement Scales
A measurement is assigning numerical value to something, usually continuous elements. Measurement is a mapping from an empirical system to a selected numerical system. The numerical system is manipulated and the results of the manipulation are studied to help the manager better understand the empirical system. Measured data is regarded as being better than counted data. It is more precise and contains more information. Sometimes, data will only occur as counted data. If the information can be obtained as either attribute or variables data, it is generally preferable to collect variables data.
Data falls into one of four levels of measurement – nominal, ordinal, interval, or ratio. The nominal, ordinal, interval, and ratio (or NOIR) scales are arranged hierarchically in terms of the capability of the data. The nominal level is the bottom and the ratio level is at the top. Each level includes all of the qualities of the one below it, and adds something new. The type of scale, and its place in the hierarchy, determines the refinement of analyses.
In a nominal scale, the values are assigned a name. A nominal scale for color could be red, blue, yellow, and green. In an ordinal scale, the values are assigned a rank. An ordinal scale for color could be light, dark, darker, and darkest. In an interval scale, the values are assigned a number. An interval scale for color could measure the wavelength in nanometers. In a ratio scale, the values are assigned a proportion based on absolute zero. A ratio scale for color could be 0 to 100% saturation.
The information content of a number is dependent on the scale of measurement used which also determines the types of statistical analyses. Hence, validity of analysis is also dependent upon the scale of measurement. The four measurement scales employed are nominal, ordinal, interval, and ratio and are summarized as
| Scale | Definition | Example | Statistics |
| Nominal | Only the presence/absence of an attribute. It can only count items. Data consists of names or categories only. No ordering scheme is possible. It has central location at mode and only information for dispersion. | go/no-go, success/fail, accept/reject | percent, proportion, chi-square tests |
| Ordinal | Data is arranged in some order but differences between values cannot be determined or are meaningless. It can say that one item has more or less of an attribute than another item. It can order a set of items. It has central location at median and percentages for dispersion. | taste, attractiveness | rank-order correlation, sign or run test |
| Interval | Data is arranged in order and differences can be found. However, there is no inherent starting point and ratios are meaningless. The difference between any two successive points is equal; often treated as a ratio scale even if assumption of equal intervals is incorrect. It can add, subtract and order objects. It has central location at arithmetic mean and standard deviation for dispersion. | calendar time, temperature | correlations, t-tests, F-tests, multiple regression |
| Ratio | An extension of the interval level that includes an inherent zero starting point. Both differences and ratios are meaningful. True zero point indicates absence of an attribute. It can add, subtract, multiply and divide. It has central location at geometric mean and percent variation for dispersion. | elapsed time, distance, weight | t-test, F-test, correlations, multiple regression |
Various data analysis methods are discussed.
Gap Analysis
It is the comparison of actual performance with potential performance. If a company or organization does not make the best use of current resources, or forgoes investment in capital or technology, it may produce or perform below its potential. This concept is similar to an economy’s being below the production possibilities frontier.
Gap analysis identifies gaps between the optimized allocation and integration of the inputs (resources), and the current allocation level. This reveals areas that can be improved. Gap analysis involves determining, documenting, and approving the difference between business requirements and current capabilities. Gap analysis naturally flows from benchmarking and other assessments. Once the general expectation of performance in the industry is understood, it is possible to compare that expectation with the company’s current level of performance. This comparison becomes the gap analysis. Such analysis can be performed at the strategic or operational level of an organization.
Gap analysis is a nonstatistical analysis method that allows you to identify, in measurable and quantifiable terms, the gap between actual performance and desired performance. Defining the gap shows where improvements must be made. Gap analysis helps target process improvement efforts and provides just cause for actions. Developing effective strategies and assigning the resources needed to reach organizational goals is easier when you know what you have to do. Use gap analysis to identify the gap between the actual and desired performance of an existing process, product, or service. Based on the findings of gap analysis, you can develop strategies to close the performance gap and achieve the desired performance objectives. While performing other analyses in the Analyze phase, you’ve used certain key metrics to establish a baseline for the process being improved. You use this baseline data during gap analysis to set process improvement goals and develop strategies for improvement.
Gap analysis is a formal study of what a business is doing currently and where it wants to go in the future. It can be conducted, in different perspectives, as
- Organization (e.g., Human Resources)
- Business direction
- Business processes
- Information technology
An example illustrates, gap analysis process as
- Identify Future State – First, identify the objectives that you need to achieve. This gives you future state – the “place” where you want to be once you’ve completed project.
| Future State | Current Situation | Next Actions/Proposals |
| Answer 90 per cent of calls within 2 minutes. |
- Analyze Current Situation – For each of objectives, analyze current situation. To do this, consider the following questions: Who has the knowledge that you need? Who will you need to speak with to get a good picture of current situation? Is the information in people’s heads, or is it documented somewhere? What’s the best way to get this information? By using brainstorming workshops? Through one-to-one interviews? By reviewing documents? By observing project activities such as design workshops? Or in some other way?
| Future State | Current Situation | Next Actions/Proposals |
| Answer 90 per cent of calls within 2 minutes. | Approximately 50 per cent of calls are answered within 2 minutes. |
- Identify How to Bridge the Gap – Once you know future state and current situation, you can think about what you need to do to bridge the gap and reach project’s objectives.
| Future State | Current Situation | Next Actions/Proposals |
| Answer 90 per cent of calls within 2 minutes. | Approximately 50 per cent of calls are answered within 2 minutes. | Develop a call volume reporting/queue modeling system to ensure that there are enough staff during busy periods.
Recruit any additional people needed. Develop a system that allows callers to book a call back during busy periods. |
Gap analysis is a nonstatistical method of analyzing processes. The steps of a gap analysis are to determine the function or area to analyze and prepare a worksheet, identify the desired performance, record actual performance, list the requirements for moving from actual to desired performance, and assign responsibility for implementing remedial actions. A gap analysis helps you to define the problem in a measurable and definable fashion. Then you can develop strategies to eliminate performance gaps.
Scenario Planning
Scenario planning is one of several nonstatistical analysis approaches that can help you and team make informed decisions. Specifically, scenario planning can help you cope with the problems of risk, uncertainty, and lack of knowledge about aspects of the future. As such, scenario planning addresses future variables that are difficult or impossible to forecast, such as raw material prices, economic growth, advancements in technology, and regime changes.
Scenario planning is a strategic planning process, where scenarios or stories are developed to explore how changes in an organization’s environment may impact it in the future. You can use scenario planning to discuss possibilities and develop potential responses to the future described in each scenario. Scenario planning is not about predicting the future. It’s about making a conscious effort to identify what’s possible. The emphasis is on considering possible scenarios other than those being predicted by the widely accepted forecasts. Scenario planning is often used to identify possible future outcomes and trends in markets, suppliers, technology, demographics, and economic variables.
Using scenario planning, you generate distinct and plausible futures. The plausible futures that will have the most impact on the organization’s business are selected for further analysis. Scenarios are developed to describe what might happen, and how the organization’s business will be impacted, should they occur. Based on these scenarios, you can prepare, plan, and take actions in the present for facing these potential scenarios in the future. The chief goal is to develop a number of potential responses to the perceived risks.
You can use scenario planning, a nonstatistical analysis tool, to explore and prepare for an uncertain future. By identifying variables of these possible futures that will have the biggest impact on organization, you can then prepare ways to deal with these possibilities if they occur. Scenario planning involves possible futures, not predictable futures. By developing scenarios about how changes in company’s external environment could impact it, you can prepare ways to handle the risk change brings – should that change happen.
Root Cause Analysis
It is a method of problem solving that tries to identify the root causes of faults or problems. A root cause is a cause that once removed from the problem fault sequence, prevents the final undesirable event from recurring. A causal factor is a factor that affects an event’s outcome, but is not a root cause. Though removing a causal factor can benefit an outcome, it does not prevent its recurrence for certain.
During the analysis phase, you can use a problem-solving approach called root cause analysis to identify the root causes of problems instead of just applying a quick fix to the surface. When you use this approach, goal is to reduce the chance that a similar problem will occur in the future. When you’re working with team during the analysis phase, you’ll frequently have to determine the root causes of problems. This will enable you to take the appropriate measures to remove the causes during the next phase of DMAIC – Improve.
RCA arose in the 1950s as a formal study following the introduction of Kepner-Tregoe Analysis, which had limitations in the highly complex arena of rocket design development and launch in the United States by the National Aviation and Space Administration (NASA).
RCA practice solves problems by attempting to identify and correct the root causes of events, as opposed to simply addressing their symptoms. Focusing correction on root causes has the goal of preventing problem recurrence. RCFA (Root Cause Failure Analysis) recognizes that complete prevention of recurrence by one corrective action is not always possible. RCA is an iterative process and a tool of continuous improvement.
RCA is typically used as a reactive method of identifying event(s) causes, revealing problems and solving them. Analysis is done after an event has occurred. Root cause analysis is a problem-solving approach used to identify the root causes of problems. It focuses on eliminating a problem’s source instead of trying to minimize the problem’s effects or symptoms. A general framework for root cause analysis involves performing three steps. First, you generate a list of possible causes. Then, you organize and group those causes. Finally, you prioritize the list of “vital few” root causes. During these steps, you’ll use several idea-generation activities and tools, including FMEA, cause and effect diagrams, Pareto charts, the 5 Whys technique, and fault tree analysis.
The 5 Whys
In analysis, asking “why” can be a good way to find the root cause of a problem. The 5 Whys analysis tool is one of several available for use during root cause analysis to generate and organize ideas. It can help you resolve problems relating to processes, products, services, or quality. As you might guess from the name, 5 Whys analysis involves asking “why?” up to five times. This technique lets you drill down into causes to find the true root cause of a problem. The goal is to eventually reach a cause that’s actionable. In other words, a cause you can do something about. The 5 Whys analysis tool is often used in conjunction with a cause and effect diagram during the three steps of root cause analysis. It can also be used with a Pareto diagram – you can use 5 Whys analysis to investigate the broad causes that were identified using a Pareto diagram. In fact, 5 Whys analysis can be useful with any of the tools in the root cause analysis toolkit.
By repeatedly asking the question ‘why?’ (use five as a rule of thumb), you can peel away the layers of an issue, just like the layers of an onion, which can lead you to the root cause of a problem. The reason for a problem can often lead into another question; you may need to ask the question fewer or more than five times before you get to the origin of a problem. The steps to complete the root cause analysis are
- Write down the specific problem. Writing it down helps you formalise the problem and describe it accurately. It also helps a team focus on the same problem
- Use brainstorming to ask why the problem occurs then, write the answer down below
- If this answer doesn’t identify the source of the problem, ask ‘why?’ again and write that answer down
- Loop back to step three until the team agrees that they have identified the problem’s root cause. Again, this may take fewer or more than five ‘whys?’
The 5 Whys technique is true to this tradition, and it is most effective when the answers come from people who have hands-on experience of the process being examined. It is remarkably simple: when a problem occurs, you uncover its nature and source by asking “why” no fewer than five times. As an example, for a problem when client is refusing to pay for the leaflets you printed for them.
- Why? The delivery was late, so the leaflets couldn’t be used.
- Why? The job took longer than we anticipated.
- Why? We ran out of printer ink.
- Why? The ink was all used up on a big, last-minute order.
- Why? We didn’t have enough in stock, and we couldn’t order it in quickly enough.
Counter-measure: We need to find a supplier who can deliver ink at very short notice.
Benefits
- Helps you to identify the root causes of a problem
- Helps you to determine the relationship between different root causes of a problem
- It is one of the simplest analysis tools as it’s easy to complete without statistical analysis
- It is easy to learn and apply
Fishbone Diagram – The 5 Whys can be used individually or as a part of the fishbone (also known as the cause and effect or Ishikawa) diagram. The fishbone diagram helps exploring all potential or real causes that result in a single defect or failure. Once all inputs are established on the fishbone, you can use the 5 Whys technique to drill down to the root causes.
Fault tree analysis (FTA)
Fault tree analysis is a tool that helps you consider underlying reasons for a specific failure mode or event. This also helps understand the relationships between them. You can use this information to prioritize risks and address the highest risks first. FTA is commonly used to search for the causes of an observed or potential failure so that problems relating to processes, products, service, or quality can be addressed and eliminated.
It is a top down, deductive failure analysis in which an undesired state of a system is analyzed using Boolean logic to combine a series of lower-level events. This analysis method is mainly used in the fields of safety engineering and reliability engineering to understand how systems can fail, to identify the best ways to reduce risk or to determine (or get a feeling for) event rates of a safety accident or a particular system level (functional) failure.
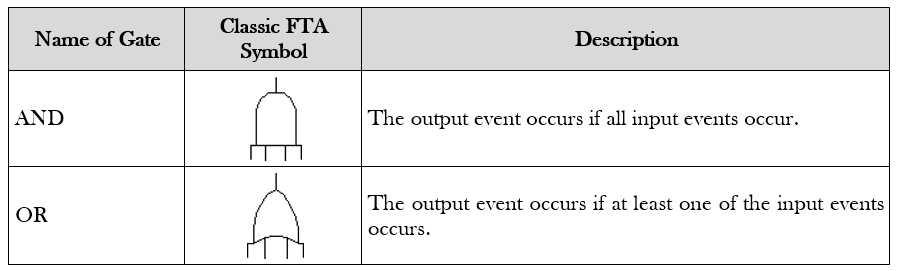
Fault trees are built using gates and events (blocks). The two most commonly used gates in a fault tree are the AND and OR gates. As an example, consider two events (or blocks) comprising a Top Event (or a system). If occurrence of either event causes the top event to occur, then these events (blocks) are connected using an OR gate. Alternatively, if both events need to occur to cause the top event to occur, they are connected by an AND gate. As a visualization example, consider the simple case of a system comprised of two components, A and B, and where a failure of either component causes system failure. The system RBD is made up of two blocks in series
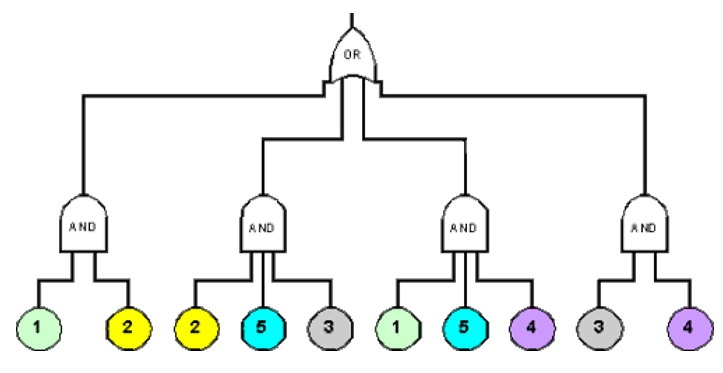
Taking an example, an inspection of a system reveals that any of the following failures will cause the system to fail
- Failure of components 1 and 2.
- Failure of components 3 and 4.
- Failure of components 1 and 5 and 4.
- Failure of components 2 and 5 and 3.
In probability terminology it can be denoted as (1 And 2) Or (3 And 4) Or (1 And 5 And 4) Or (2 And 5 And 3). The consecutive fault tree as
FTA is also the preferred method when you can identify a few well-differentiated top events, since a top event is the starting point of an FTA. And when there’s a high risk of failure due to human or software errors, FTA is the best method because, for one thing, the precision and accuracy of the FTA makes it ideal for analysis where high risks are involved. It also enables teams to quantify the probabilities of errors or faults more closely.
Fault tree analysis – or FTA – is a tool that’s used to define a specific unwanted event and determine all the possible reasons it could occur. FTA uses a hierarchical approach and failure logic to take a complex system and assess the paths and probabilities that contribute to a specific system failure. The FTA process has five steps. First, you select a component for analysis and identify the top event. Next, you identify causes for the fault using “and” or “or” gates. The third step involves working toward root causes by creating a tree of contributing causes. You then assign probabilities to each cause and prioritize the causes. Finally, you identify countermeasures for each root cause. Failure modes and effects analysis – or FMEA – is another tool you can use for identifying, tracking, and prioritizing failures and risks.
