Coordinate System
In geometry, a coordinate system is a system which uses one or more numbers, or coordinates, to uniquely determine the position of a point or other geometric element. Various coordinate systems, are
Number line – The simplest example of a coordinate system is the identification of points on a line with real numbers using the number line. In this system, an arbitrary point O (the origin) is chosen on a given line. The coordinate of a point P is defined as the signed distance from O to P, where the signed distance is the distance taken as positive or negative depending on which side of the line P lies. Each point is given a unique coordinate and each real number is the coordinate of a unique point.

Cartesian coordinate system – The prototypical example of a coordinate system is the Cartesian coordinate system. In the plane, two perpendicular lines are chosen and the coordinates of a point are taken to be the signed distances to the lines.
In three dimensions, three perpendicular planes are chosen and the three coordinates of a point are the signed distances to each of the planes. This can be generalized to create n coordinates for any point in n-dimensional Euclidean space.
Everything that you draw in AutoCAD is exact. It will be more accurate than you will ever need it to be. All objects drawn on the screen are placed there based on a simple X,Y co-ordinate system. In AutoCAD this is known as the World Co-ordinate System (WCS). You must understand this to know how to put things where you want them. (3-D work has an added axis, the Z-axis)
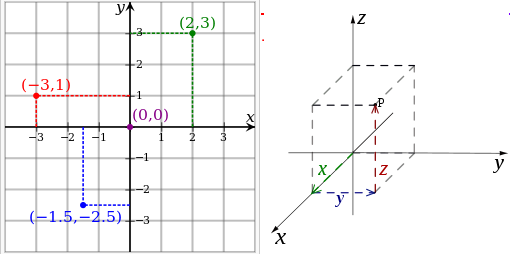
AutoCAD uses points to determine where an object is located. There is an origin where it begins counting from. This point is (0,0). Every object is located in relation to the origin. If you were to draw a line straight out to the right from the origin, this would be considered the positive X-axis. If you were to draw a line straight up, this would be the positive Y-axis. The picture above shows a point located at (9,6). This means that the point is 9 units over in the X-axis and 6 units up in the Y-axis. When you are working with points, X always comes first. The other point shown is (-10,-4). This means that the point is 10 units in the negative X-axis (left) and 4 units in the negative Y-axis (down).
A line has two points, a start point and an end point. AutoCAD works with the points to display the line on the screen. Move your cursor over the picture above and you will see line drawn from the absolute points of (-10,-4) to (9,6).
Most of the time you will not have an indication of where the origin is. You may need to draw a line from the endpoint of an existing line. To do this you use relative points. These work the same way, but you have to add the @ symbol (shift+2) to tell AutoCAD that this next point is relative from the last point entered.
Polar coordinate system – Another common coordinate system for the plane is the polar coordinate system. A point is chosen as the pole and a ray from this point is taken as the polar axis. For a given angle θ, there is a single line through the pole whose angle with the polar axis is θ (measured counterclockwise from the axis to the line). Then there is a unique point on this line whose signed distance from the origin is r for given number r. For a given pair of coordinates (r, θ) there is a single point, but any point is represented by many pairs of coordinates. For example, (r, θ), (r, θ+2π) and (−r, θ+π) are all polar coordinates for the same point. The pole is represented by (0, θ) for any value of θ.
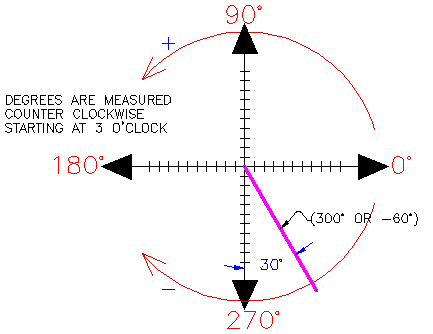
AutoCAD measures angles in a particular way also. Look at the diagram below and then place your mouse on it to see how this is done. When drawing lines at an angle, you have to begin measuring the angle from 0 degrees, which is at the 3 o’clock position. If you drew a line at 90 degrees, it would go straight up. The example above (when you move your mouse over it) shows a line drawn at +300 degrees (270+30), or -60 degrees.
You might not always have an obvious reference point for 0 degrees. The image shows the angle for 30 DEGREES.
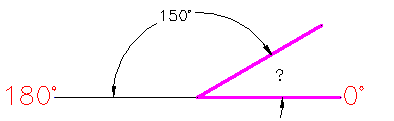
In this example, you are given information about the lines, but not the angle AutoCAD needs to draw the line from the start point. What you are given though, is (a) the knowledge that 0° is at the 3 o’clock position (b) the knowledge that 180° is at the 9 o’clock position and (c) the angle between 180° and the line you want to draw is 150°. With this information, you can figure out what angle you need. Here is a fool-proof way of getting the angle you need:
- Start at the 0° position and measure counter-clockwise (+) to 180°.
- From 180°, measure clockwise 150°.
- Consider that you just went +180-150 and use that as an equation: +180-150=30
- Now you can draw your line using polar co-ordinates
Point
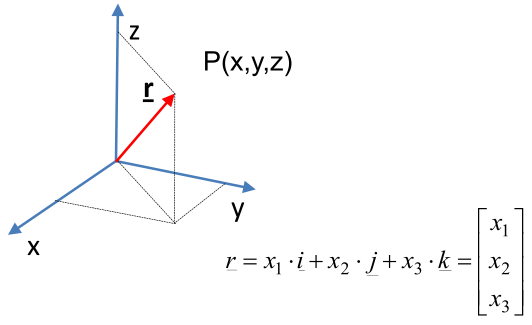
In a CAD system in the 3D virtual space the geometric elements are represented in a Descartian coordinate system by x, y, and z values.
The simplest geometric element is the point, which is used as datum elements in a CAD modelling. The representation of a point is done by the 3 coordinate value.
You can enter points directly on the command line using three different systems. The one you use will depend on which is more applicable for the situation. The first assignment will get you used to this. The three systems are as
- Absolute co-ordinates – Using this method, you enter the points as they relate to the origin of the WCS. To enter a point just enter in the exact point as X,Y.
- Relative co-ordinates – This allows you to enter points in relation to the first point you have entered. After you’ve entered one point, the next would be entered as @X,Y. This means that AutoCAD will draw a line from the first point to another point X units over and Y units up relative to the previous point.
- Polar co-ordinates – You would use this system if you know that you want to draw a line a certain distance at a particular angle. You would enter this as @D<A. In this case, D is the distance and A is the angle. Example: @10<90 will draw a line 10 units straight up from the first point.
The three ways of entering co-ordinates shown above are the ONLY way AutoCAD accepts input. First decide which style you need to use, and then enter as shown. Remember that X is always before Y (alphabetical). Don’t forget the ‘@’ symbol when you are entering relative points. Any typing error or omission will give you results you don’t want. If you make a mistake and need to see what you typed, press F2 to bring up the text screen and check your typing. (press F2 to get back to your drawing.)
Curves
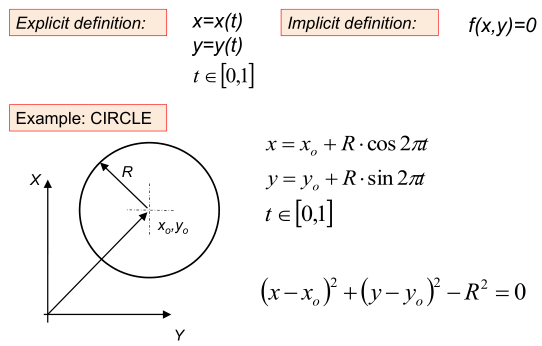
A curve is a continuous set of points. A curve can be defined by explicit or implicit definition. The explicit formula is suitable for generating the points of the curve, and the implicit formula is suitable for investigating a location of a point. If the value of the formula is 0, the given point is the part of the curve.
In the CAD practice the explicit definition is applied. The example shows the definition of a circle. The radii of the circle is R and the centre point is x o , y o.
3D Curves
The 3 D curves can be defined by explicit formula. The example shows the definition of a line,
which go through (x 1 ,y 1 ,z 1 ) and (x 2 ,y 2 ,z 2 ) points.
The classic curves, like line, circle, ellipse etc.) have explicit definition, but a general curve hasn’t got a description. These curves can be defined by polynoms, which are adjusted by a i , b i , c i factors. The polynoms can be differentiated continuously, which is essential for many investigation.
Complex Curves
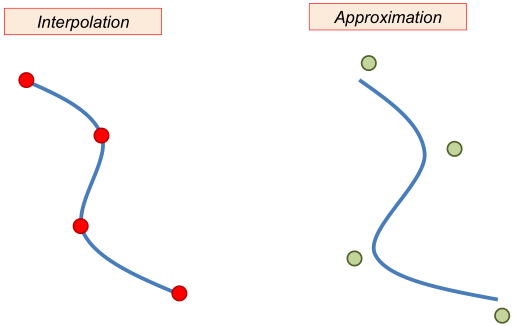
The set of factors are not so easy, therefore we use control points in the CAD environment in order to define a curve. We can speak about interpolation, if the curve goes through these points, or approximation, if the curve draws near to these points. Both of these methods are used in theoretic mathematic description and in CAD systems.
A complex curve can be defined by many points. We can use two strategy
- Use a high degree polynom, or
- Multisegment low degree polynoms.
The high degree polynoms sometimes become wave, therefore we prefer the second way of curve design. The connecting segments have to be continuous, and the continuity has different aspects.