Spreadsheet packages are good at numerical manipulation and have a wide range of financial and mathematical functions. It is easy to present calculations in a readable form and to mix text and graphical display. Spreadsheets are enormously popular, widely available and easy to use.
The flexibility of spreadsheets makes it possible to use them to tackle problems that would be more appropriately modeled with different software. Their availability and ease of use makes this an extremely common mistake. Before one can design a spreadsheet, he/she needs to make sure that a spreadsheet is the most appropriate tool for the job.
Excel has a wide range of add-in functions that allows a lot of specific calculations. Many of these can be very useful, but if it is found that many are used, it may suggest specialist packages. For example, if a person is using a lot of the database functions, he probably should be using database software.
The table below compares the strengths and weaknesses of a number of different analysis packages.
| Software Type | Strengths | Weaknesses |
| Spreadsheets e.g.: Microsoft Excel, Lotus 123 | ü numeric manipulation; ü financial functions; ü user interface; ü graphical reports; ü easy to learn; and ü time series modeling. | ü handling large quantities of data; ü multi-dimensional data; ü systems with feedback or circularity; ü looping and branching; and ü can develop “black box” systems. |
| Databases e.g.: Microsoft Access | ü handling large volumes of data; ü user interface; ü can develop “black box” systems; and ü Multi-dimensional data. | ü complex calculations; ü complex report structures; ü graphical reports; and ü time series modeling. |
| Statistical software e.g.: SAS | ü handling large volumes of data; and ü Complex statistical functions. | ü expensive; and ü More difficult to learn. |
| Multi-dimensional packages e.g.: Oracle Financial Analyser | ü multi-dimensional data; ü handling large volumes of data; ü “slice and dice” reporting; and ü Aggregation of data. | ü specialised use; ü more difficult to learn; ü expensive; and ü used more for information reporting than modeling. |
| System Dynamics packages e.g.: Vensim, Powersim | ü systems with feedback or circularity; ü “soft” variables such as staff morale; ü multi-dimensional data; and ü graphical representation of the model structure. | ü producing financial statements; ü difficult to understand and accept the processes; and ü specialised skills required to develop and maintain. |
| Rules based packages e.g.: Applications Manager | ü can develop “black box” systems; and ü looping and branching. | ü specialised use; and ü more difficult to learn. |
MS-EXCEL Window Elements
Microsoft Excel is a Spreadsheet package that is widely used for data analysis purpose. The workspace called the workbook is divided into a number of sheets called the worksheet. The screen that appears on opening MS-EXCEL is-
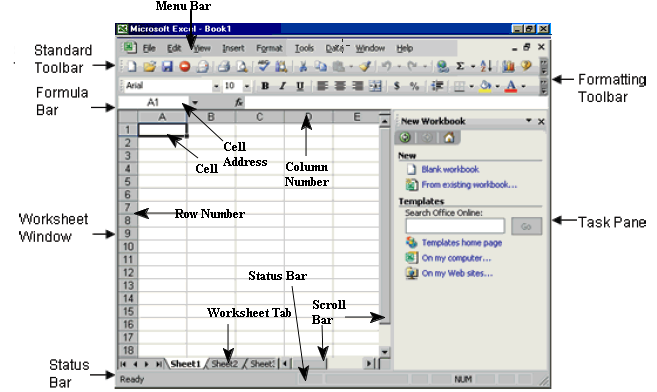
MS-EXCEL screen
Various elements are
- Menu Bar – It is below the title bar of the window, listing all drop down menu of MS-Excel It has nine drop down menus.
- Status Bar – It is placed at the bottom of the window display status of keyboard lock keys (Num, scroll, Caps) and other computed result
- Row and Row Number – The horizontal lines are called the rows these are numbered 1,2,3 and so on up to 65536.
- Column and Column Number – The vertical lines are called the columns these named A, B, C and so on up to IV.
- Cell – The intersection of the rows and the columns is called the cell.
- Cell Address – The cell address comprises of the column name and the row address; therefore, the cell address of the very first cell would be A1 i.e. first column and first row. The first cell has “A1” as its address and last cell’s address is IV65536
- Workbooks – In Microsoft Excel, a workbook is the file in which we work and store our data. Because each workbook can contain many sheets, we can organize various kinds of related information in a single file.
- Worksheets – Use worksheet (The primary document that we use in Microsoft Excel to store and work with data. It is also called as a spreadsheet. A worksheet consists of cells that are organized into columns and rows; a worksheet is always stored in a workbook.) to list and analyze data. We can enter and edit data on several worksheets simultaneously and perform calculations based on data from multiple worksheets. When we create a chart, we can place the chart on the worksheet with its related data or on a separate chart sheet. Each worksheet is divided into rows and columns.
- Work Sheet tabs – The names of the sheets appear on tabs at the bottom of the workbook window. To move from sheet to sheet, click the sheet tabs.
If you used formulas of any sort at school, you will find it easy to use formulas in Excel. The same structure or syntax applies; that is, if you want to multiply two numbers (say, 5 and 6) together, on paper you would write 5 x 6, and in Excel you would type 5*6. The obvious difference is that Excel uses an asterisk as the symbol for multiplication. There is a short list of the main symbols used below. You will see that they are mainly as written at school.

A formula is a cell entry that calculates values to return a result. Each Excel formula must have three key elements: the equal sign (=) that signifies that the entry is a formula, the values or cell references to be calculated, and the mathematical operators, such as a plus sign (+) for addition or a minus sign (-) for subtraction.
All Excel formulas must begin with the equal sign. The equal sign tells Excel that the entry is a formula. If your formula begins without an equal sign, Excel treats it as a regular cell entry and doesn’t perform the calculation.
To enter a formula
- select a cell and type the equals symbol (=) or a plus (+) sign
- begin typing the information (numbers or operator symbols)
- you can insert a cell reference into your entry by typing, by pointing and clicking the cell, or by selecting the range
- when finished, enter the information by pressing Enter OR by clicking on the tick button in the Formula bar
- if the entry needs to be changed, then cancel it with the ESC key OR the cross button in the formula bar, provided it has not yet been entered
- if you make a mistake while typing, use the Backspace key to remove a character to the left of the cursor
- once the formula is entered, one can make changes by selecting the cell and clicking in the formula bar, OR by double clicking the cell, to go into edit mode.
Operators
When you create a formula in Excel, you need to include an operator. All formulas must contain mathematical operators so that Excel knows what calculation to perform.
| Operator | What It Does |
| + | Addition |
| – | Subtraction |
| * | Multiplication |
| / | Division |
| = | Equal to |
| < | Less than |
| <= | Less than or equal to |
| > | Greater than |
| >= | Greater than or equal to |
| <> | Not equal to |
| % | Percentage |
| ^ | Exponentiation |
Order of Operations
In a simple formula, Excel performs only one calculation. However, formulas can often contain instructions to perform multiple calculations. If you were to talk out a more complicated formula, you might say something like this: “Add together the price of a car that costs Rs. 20,000 and a truck that costs Rs.18,000 and then multiply the combined price by 5% sales tax to determine the sales tax due on the combined cost of the vehicles.”
You might think that you’d enter the value for the formula this way
=20,000+18,000*.050
However, if you typed that formula in a cell, the formula would be incorrect. The reason is that Excel uses something called operator precedence to perform calculations. Operator precedence determines the order in which calculations are performed. Calculations are performed from left to right in the following order
- All operations enclosed in parentheses
- All exponential operations
- All multiplication and division operations
- All addition and subtraction operations
The best way to force Excel to calculate your formulas correctly is to use parentheses. Group the values and operators that you want to calculate first in parentheses. For example, the formula
(20,000+18,000)*.050
It tells Excel to first add the numbers within the parentheses and then to calculate the sales tax percentage on the total. The parentheses tell Excel to perform the addition first and then multiply the sum by the tax percentage.
You can even nest parentheses within parentheses to further break down how you want Excel to calculate your formula. Just remember that each opening parenthesis must have a closing parenthesis. If your formula does not contain the required number of parentheses, Excel displays an error message
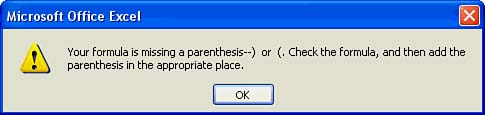
Formula Error
Formulas and their components
A formula is also defined as, a sequence of values, cell references, names, functions, or operators in a cell that together produce a new value. A formula always begins with an equal sign (=).
The values on which a numeric formula performs a calculation are called operands. Numbers or cell references can be operands in a formula. Usually cell references are used, and when the numeric entries in the referenced cells change, the result of the formula is automatically recalculated. We can also use single-word row and column headings in place of cell references and formulas.
Tracing precedents and dependents
Sometimes, checking formulas for accuracy or finding the source of an error can be difficult when the formula uses precedent or dependent cells:
- Precedent cells are cells that are referred to by a formula in another cell. For example, if cell D10 contains the formula =B5, cell B5 is a precedent to cell D10.
- Dependent cells contain formulas that refer to other cells. For example, if cell D10 contains the formula =B5, cell D10 is a dependent of cell B5.
Tracing precedents and dependents show you what other cells are affected by or are affecting a certain cell. Arrows are displayed to show the precedent and dependent cells.
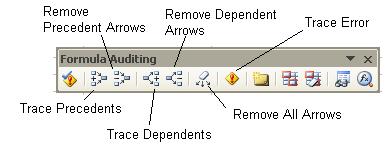
- Select the cell containing the formula you want to trace
- Click either the Trace Precedents or Trace Dependents button on the Formula Auditing toolbar
- Trace Precedents: Displays arrows showing the cells affecting the selected cell.
- Trace Dependents: Displays arrows showing the cells being affected by the selected cell.
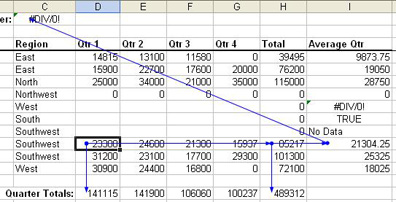
Arrows appear showing cells related to the formula in the selected cell. Dots appear on the arrows to identify the specific cells. An icon is used to indicate precedents or dependents on another worksheet. The image below is displaying the dependents of cell D11.
- To remove arrows from the worksheet:
- Click either the Remove Precedent Arrows, Remove Dependent Arrows or Remove All Arrows button on the Formula Auditing toolbar, or
- The relevant tracing arrows disappear.
Formula Errors
The Error Checking feature of Excel helps us to deal with formula errors. A formula error appears whenever a formula cannot function and complete its task.
Error Checking
Error checking can be performed on an individual cell or on the entire worksheet. To error check an individual cell:
- Select the cell containing the formula error
- Point to the smart tag icon that appears in the corner of the cell. A tip appears explaining why you are getting this type of error. Click on the smart tag to display a list of error checking options.
