Analytics refers to the skills, technologies, practices for exploration and investigation of past performance to gain insight and drive business planning. Analytics focuses on developing new insights and understanding of business performance based on data and statistical methods. In contrast, business intelligence traditionally focuses on using a consistent set of metrics to both measure past performance and guide business planning, which is also based on data and statistical methods.
Analytics makes extensive use of statistical analysis, including explanatory and predictive modeling, and fact-based management to drive decision making. Analytics may be used as input for human decisions or may drive fully automated decisions.
Analytics can be defined as a process that involves the use of statistical techniques (measures of central tendency, graphs, and so on), information system software (data mining, sorting routines), and operations research methodologies (linear programming) to explore, visualize, discover and communicate patterns or trends in data. Simply, analytics convert data into useful information. Analytics is an older term commonly applied to all disciplines, not just business. A typical example of the use of analytics is the weather measurements collected and converted into statistics, which in turn predict weather patterns.
Querying, reporting, OLAP, and alert tools can answer questions such as what happened, how many, how often, where the problem is, and what actions are needed. Business analytics can answer questions like why is this happening, what if these trends continue, what will happen next (or, predict), what is the best that can happen (or, optimize).
Business analytics is the scientific process of transforming data into insight for making better decisions. Business analytics is used for data-driven or fact-based decision making, which is often seen as more objective than other alternatives for decision making.
Analytics have been used in business since the management exercises were put into place by Frederick Winslow Taylor in the late 19th century. Henry Ford measured the time of each component in his newly established assembly line. But analytics began to command more attention in the late 1960s when computers were used in decision support systems. Since then, analytics have changed and formed with the development of enterprise resource planning (ERP) systems, data warehouses, and a large number of other software tools and processes.
In later years the business analytics have exploded with the introduction to computers. This change has brought analytics to a whole new level and has made the possibilities endless. As far as analytics has come in history, and what the current field of analytics is today many people would never think that analytics started in the early 1900s with Mr. Ford himself.
Business Analysis was introduced when Information Technology change projects started to face difficulties in the 1980s. Before that, IT change projects could solve only a limited set of problems in a limited way because the only options were to turn paper based data into electronic data and have simple programs automate the use of that data. A few of the limitations were
- storage of the electronic data was expensive
- the way data was stored was cumbersome (flat files read sequentially in one direction only).
- programs were difficult to write in abstract languages
- there was only a limited set of functionality based around mainframe processes
- user interfaces were delivered on basic green-screens
Since the 1980s data storage has become cheaper and covers not just paper based data but audio and visual data too. Other changes that have come about are
- Relational, object orientated and other databases have made access to data easier
- Programming languages have evolved in usability and functionality
- Processing is no longer constrained to mainframes but distributed with increasingly sophisticated user interfaces.
The internet generated a whole new market place and set of business models, as well as a new set of technological possibilities. There are now thousands of ‘legacy’ systems being upgraded, merged and replaced. The universe of business solutions is an ever expanding one.
The result of all this change was that there are many more choices to make at each stage of an IT and/or any other type of change project. This increases the chances of choosing the wrong method to analyse the project/business. These wrong choices invalidate the subsequent work based on that wrong choice. Going further, the earlier in the project that a wrong choice is made, the greater the damage is in terms of how much re-work is required. With large projects, the inaccurate decisions have larger repercussions.
Challenges
Business analytics depends on sufficient volumes of high quality data. The difficulty in ensuring data quality is integrating and reconciling data across different systems, and then deciding what subsets of data to make available.
Previously, analytics was considered a type of after-the-fact method of forecasting consumer behavior by examining the number of units sold in the last quarter or the last year. This type of data warehousing required a lot more storage space than it did speed. Now business analytics is becoming a tool that can influence the outcome of customer interactions. When a specific customer type is considering a purchase, an analytics-enabled enterprise can modify the sales pitch to appeal to that consumer. This means the storage space for all that data must react extremely fast to provide the necessary data in real-time.
Scope
Banks, such as Capital One, use data analysis (or analytics, as it is also called in the business setting), to differentiate among customers based on credit risk, usage and other characteristics and then to match customer characteristics with appropriate product offerings. Harrah’s, the gaming firm, uses analytics in its customer loyalty programs. E & J Gallo Winery quantitatively analyzes and predicts the appeal of its wines. Between 2002 and 2005, Deere & Company saved more than $1 billion by employing a new analytical tool to better optimize inventory. Example : It can help you focus on the fundamental objectives of the business and the ways analytics can serve them. A telecoms company that pursues efficient call centre usage over customer service might save money.
Relevance
Data analysis is important to businesses will be an understatement. In fact, no business can survive without analyzing available data. Visualize the following situations:
- A pharma company is performing trials on number of patients to test its new drug to fight cancer. The number of patients under the trial is well over 500.
- A company wants to launch new variant of its existing line of fruit juice. It wants to carry out the survey analysis and arrive at some meaningful conclusion.
- Sales director of a company knows that there is something wrong with one of its successful products, however hasn’t yet carried out any market research data analysis. How and what does he conclude?
These situations are indicative enough to conclude that data analysis is the lifeline of any business. Whether one wants to arrive at some marketing decisions or fine-tune new product launch strategy, data analysis is the key to all the problems. What is the importance of data analysis – instead, one should say what is not important about data analysis.
Merely analyzing data isn’t sufficient from the point of view of making a decision. How does one interpret from the analyzed data is more important. Thus, data analysis is not a decision making system, but decision supporting system.
Data analysis can offer the following benefits
- Structuring the findings from survey research or other means of data collection
- Break a macro picture into a micro one
- Acquiring meaningful insights from the dataset
- Basing critical decisions from the findings
- Ruling out human bias through proper statistical treatment
Types of Analytics
- Decisive analytics: supports human decisions with visual analytics the user models to reflect reasoning.
- Descriptive Analytics: Gain insight from historical data with reporting, scorecards, clustering etc.
- Predictive analytics predictive modeling using statistical and machine learning techniques
- Prescriptive analytics recommend decisions using optimization, simulation etc.
Analytics is the process of transforming raw data into actionable strategic knowledge in order to gain insight into business processes, and thereby to guide decision-making to help businesses run efficiently. An analytics process can b e categorized into one of three categories:
- Descriptive Analytics – It looks at an organization’s current and historical performance.
- Predictive Analytics – It forecasts future trends, behavior, and events for decision support.
- Prescriptive Analytics – It determines alternative courses of actions or decisions, given the current and projected situations and a set of objectives, requirements, and constraints.
Levels of Analytics
There are an eight levels of “Intelligence through Analytics” which have been outlined by SAS as
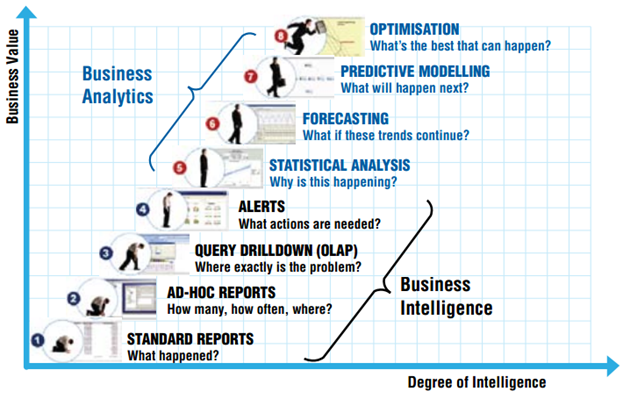
- Standard Reports – The first level of the analytical ladder focuses on understanding what had happened. For example, imagine reviewing a company’s annual report and pinpointing the various events that had occurred. “What was sold?”, “What was bought?”, “What was the volume of fraudulent cases detected?” etc.
- Ad-Hoc Report – Now that we had understood and captured the events what had happened, secondary questions may surface. Such as, “When did it happen?”, “How many times did it occur during a particular period of time?”.
- Query Drilldowns – Online Analytical Processing (OLAP) Diving deeper into the event, answering questions such as, “Where did the event happen?”, “Where exactly was the problem?”.
- Alerts – Finally, the concluding stage of the first four levels is alerts. Given the previous three levels, we are keen to act/re-act on the uncovered information by triggering various business specific alerts. What are the actions needed when threshold is breached?
These four levels are common practice in almost all organisations as the foundation of standard business operations. The four levels are known as part of Business Intelligence. That is, the presentation and reporting of historical data. Furthermore, a secondary attribute of Business Intelligence system is that the user knows what they are looking and/or the basic analysis required to produce it. The subsequent levels are where analytical processes kick in.
- Statistical Analysis – In this level we aim to go beyond the realm of ‘what’ and ‘where’, to dive into the hidden gems of the data to understand why , the event had happened. Such knowledge is the foundation of understanding how to identify, prevent, exploit, and so forth.
- Forecasting – Until this stage we had focused entirely on deriving insight from historical data, one of the key elements of analytics is the capability of statistical forecasting. Will this observed trend continue and for how long? Furthermore, this stage is analogous to driving a car – one needs to have a front windscreen in order to know what is likely to happen.
- Predictive Modeling – This stage is focused on uncovering the unknown from the data at hand to surface new insights that may not have been previously known, also to provide the foundation for predicting future events, “What will happen next?” and “Why will it happen?”, such as the likelihood of events occurring.
- Optimisation – The cherry on top of the pie, optimisation or also referred to as Operation Research (OR), combines all the previous levels to optimise business processes/objectives given operational and other constraints. How to maximise profit, minimise cost? How to optimally allocate resources?
These four final levels construe Business Analytics, the uncovering of insights from historical data and the projections into future, using analytical processes in alignment to business requirements. To place the full eight levels into a more relatable context, assume the case of customer complaints. The type of questions and insights generated at each of the stages could be the following: