A gap analysis is process that compares actual performance or results with what was expected or desired. The method provides a way to identify suboptimal or missing strategies, structures, capabilities, processes, practices, technologies or skills, and then recommends steps that will help the company meet its goals.
By comparing the current state with the target state, companies, business units, or teams can determine what they need to work on to make their performance or results better and get on the right path quicker. Companies can also use the gap analysis process to elevate individual or team performance, and look at attributes such as task competency, performance level, and productivity. Other names for the process include need-gap analysis, needs analysis, and needs assessment.
A gap analysis is an examination and assessment of your current performance for the purpose of identifying the differences between your current state of business and where you’d like to be. It can be boiled down into a few questions:
- Where are we now?
- Where do we wish we were?
- How are we going to close the gap?
Conducting a gap analysis can help you improve your business efficiency, your product, and your profitability by allowing you to pinpoint “gaps” present in your company. Once it’s complete, you’ll be able to better focus your resources and energy on those identified areas in order to improve them.
Gap Analysis Use Cases
While there are a myriad of business areas (e.g. accounting, sales, customer service, HR) and situations that can use the gap analysis process, here are a few examples that illustrate the broad range of ways a company can use a gap analysis:
- New Product Launch: After a company launches a new product, they might do a gap analysis to determine why sales didn’t meet forecasts.
- Productivity: When a factory’s productivity is not meeting expectations, targeted customer needs, or the set of business requirements that were laid out a gap analysis can help determine what process to fix.
- Supply Management: If a hospital finds itself running short of supplies on a regular basis, they could perform a gap analysis to identify the reason why.
- Sales Performance: A manufacturer can look at the sales performance of their catalog of products to make sure they are producing the right mix, and use the result to maximize their production–possibility frontier.
- Individual Assessment: A team leader at an accounting firm can have each member perform a gap analysis on themselves, and use those results not only to find targets to improve each person’s performance, but also to draw out the best practices that everyone can adopt.
- Product Evaluation: A software company might perform a gap analysis of their product to ensure that all features and functions outlined in the business requirements are present and working as expected.
Gap Analysis Process
There’s no standard process for doing a Gap analysis since it should usually be tailored to meet your business needs. But here are the steps a typical Gap analysis would follow.
Step 1: Pick an Area to Focus on
First of all, you need to know where to focus on during the analysis.
Whether it’s from finance, product quality, marketing etc., pick that specific problem area you need to drill down on. For example, if it’s marketing, a specific area would be social media marketing. Being specific will help you focus better during the Gap analysis.
Step 2: What are Your Targets/ Goals?
Now that you know the area you need to improve, it’s time to set goals or targets. Not only these goals should be realistic, which mean that they should be achievable within a certain time limit you set, but they should also align with your business goals.
These goals you set will help you define the future state in the 4th step.
Step 3: Determine the Current State of Things
Before you step forward, you need to know where you are standing. In this step, you’ll figure out the current state of things.
By looking into reports or process documentation, doing interviews, brainstorming etc. gather as much data as possible to clarify how you are performing at present.
Step 4: Determine the Future State of Things
Remember the goals you set in step 2? Achieving these goals will help you get to the future state or the desired situation you want your business to be in. Define what the parameters of the ideal state of your business are.
Step 5: Identify the Gaps between the Two States
Now you have an understanding of the attributes of your current state and the future state, it is easier to identify what is stopping you from reaching your goals.
After identifying these gaps, come up with the steps you need to take to close them.
Gap Analysis Tools
Once you have identifies what the gaps are, you need to look into why they exist and what you can do about them. There are a few gap analysis models you can use for this task. Following we have listed a few Gap analysis tools that you can use.
SWOT
SWOT analysis focuses on Strengths and Weaknesses in the internal environment and Opportunities and Threats in the external environment. It helps you determine where you stand within your industry or market.
How to do it;
- Gather around a team from relevant teams/ departments
- Create a SWOT analysis matrix; you can either use the one below or choose from these SWOT analysis examples
- List down the internal strengths and weaknesses of your business
- Note down the opportunities and threats present in the industry/ market
- Rearrange each bullet point in the order of highest priority at the top, and lowest at the bottom
- Analyze how you can use your strengths to minimize weaknesses and fight off threats, and how you can use the opportunities to avoid threats and get rid of weaknesses
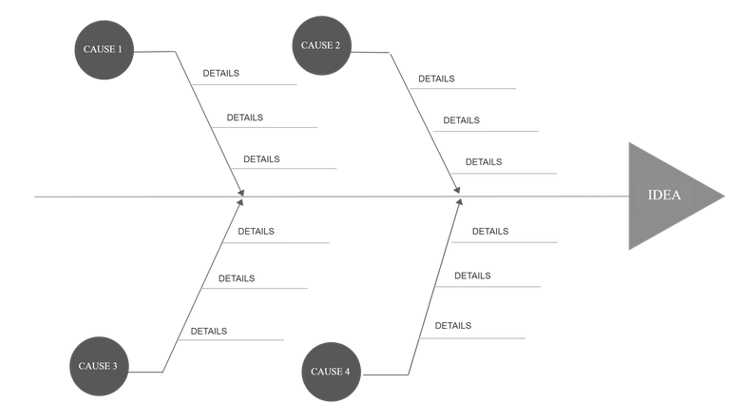
Fishbone
Fishbone diagram, also known as cause and effect diagram or Ishikawa diagram, helps you identify the root cause of an issue or effect. It lists the 6 Ms (listed in the diagram below) and helps you see how they relate to the central problem.
Fishbone diagrams can be defined as a diagram that shows the possible causes of a specific event or a problem. They were first introduced by Kaoru Ishikawa in 1968 which is why they are sometimes referred to as Ishikawa diagrams. He pioneered the quality management processes at Kawasaki and used Ishikawa diagrams as part of the process.
McKinsey 7S
McKinsey 7S can help you with any of the following purposes
- To help understand the gaps that may appear in the business
- Identify which areas to optimize to boost business performance
- Align processes and departments during a merger or acquisition
- Examine the results of future changes within the business
The 7s refer to key interrelated elements of an organization. They are as follow,
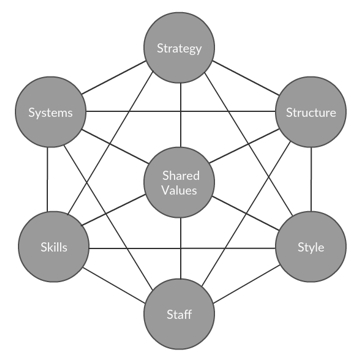
These elements are divided into two groups; hard elements, which are tangible as they can be controlled, and soft elements which are intangible as they cannot be controlled.
Hard elements
- Strategy – the plan of actions that will help your business gain a competitive advantage
- Structure – the organizational structure
- Systems – business and technical infrastructure employees use to do their daily tasks
Soft elements
- Shared values – a set of beliefs or traits the organization upholds
- Style – the leadership style of the organization and the culture of interaction
- Staff – the general staff
- Skills – key skills of employees
How to apply it;
- Gather around a competent team
- Check whether the elements are properly aligned with each other (look for gaps and weaknesses in the relationship between the elements)
- Define the state where these elements would be optimally aligned
- Come up with an action plan to realign the elements
- Implement the changes and continuously review the 7s, moving forward
Nadler-Tushman’s Congruence Model
The Nadler-Tushman’s congruence model is used to identify performance gaps within an organization.
It is based on the principle that a business’s performance is a result of these 4 elements; work, people, structure and culture. The higher the compatibility among these elements, the greater the performance will be.
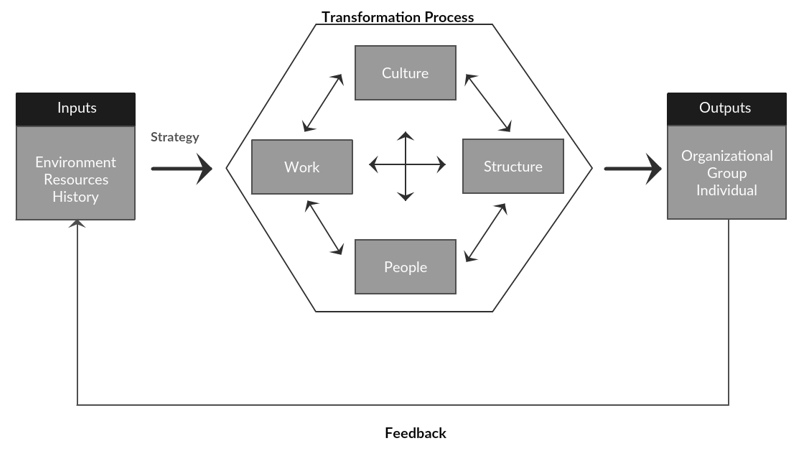
How to apply it;
- Gather all data that points at the symptoms of poor performance
- Specify and analyze inputs which include the environment, resources and history. And define your organization’s strategy.
- Identify which outputs are required at individual, group and organizational levels to meet the strategic objectives
- Figure out the gaps between desired and actual output and the problems associated with it (and mark down the costs associated with them as well)
- Collect data on and describe the basic nature of the 4 major components of the organization
- Assess the degree of congruence among these components
- See how poor congruence and problems related to outputs are correlated. Check if the poor ‘fit’ of the 4 major components are related to the problems
- Come up with action steps to deal with the problem causes
Burke-Litwin Causal Model
This tool helps you understand the different components of an organization relate to each other when going through a period of change. There are 12 components that are interrelated and they are as follow,
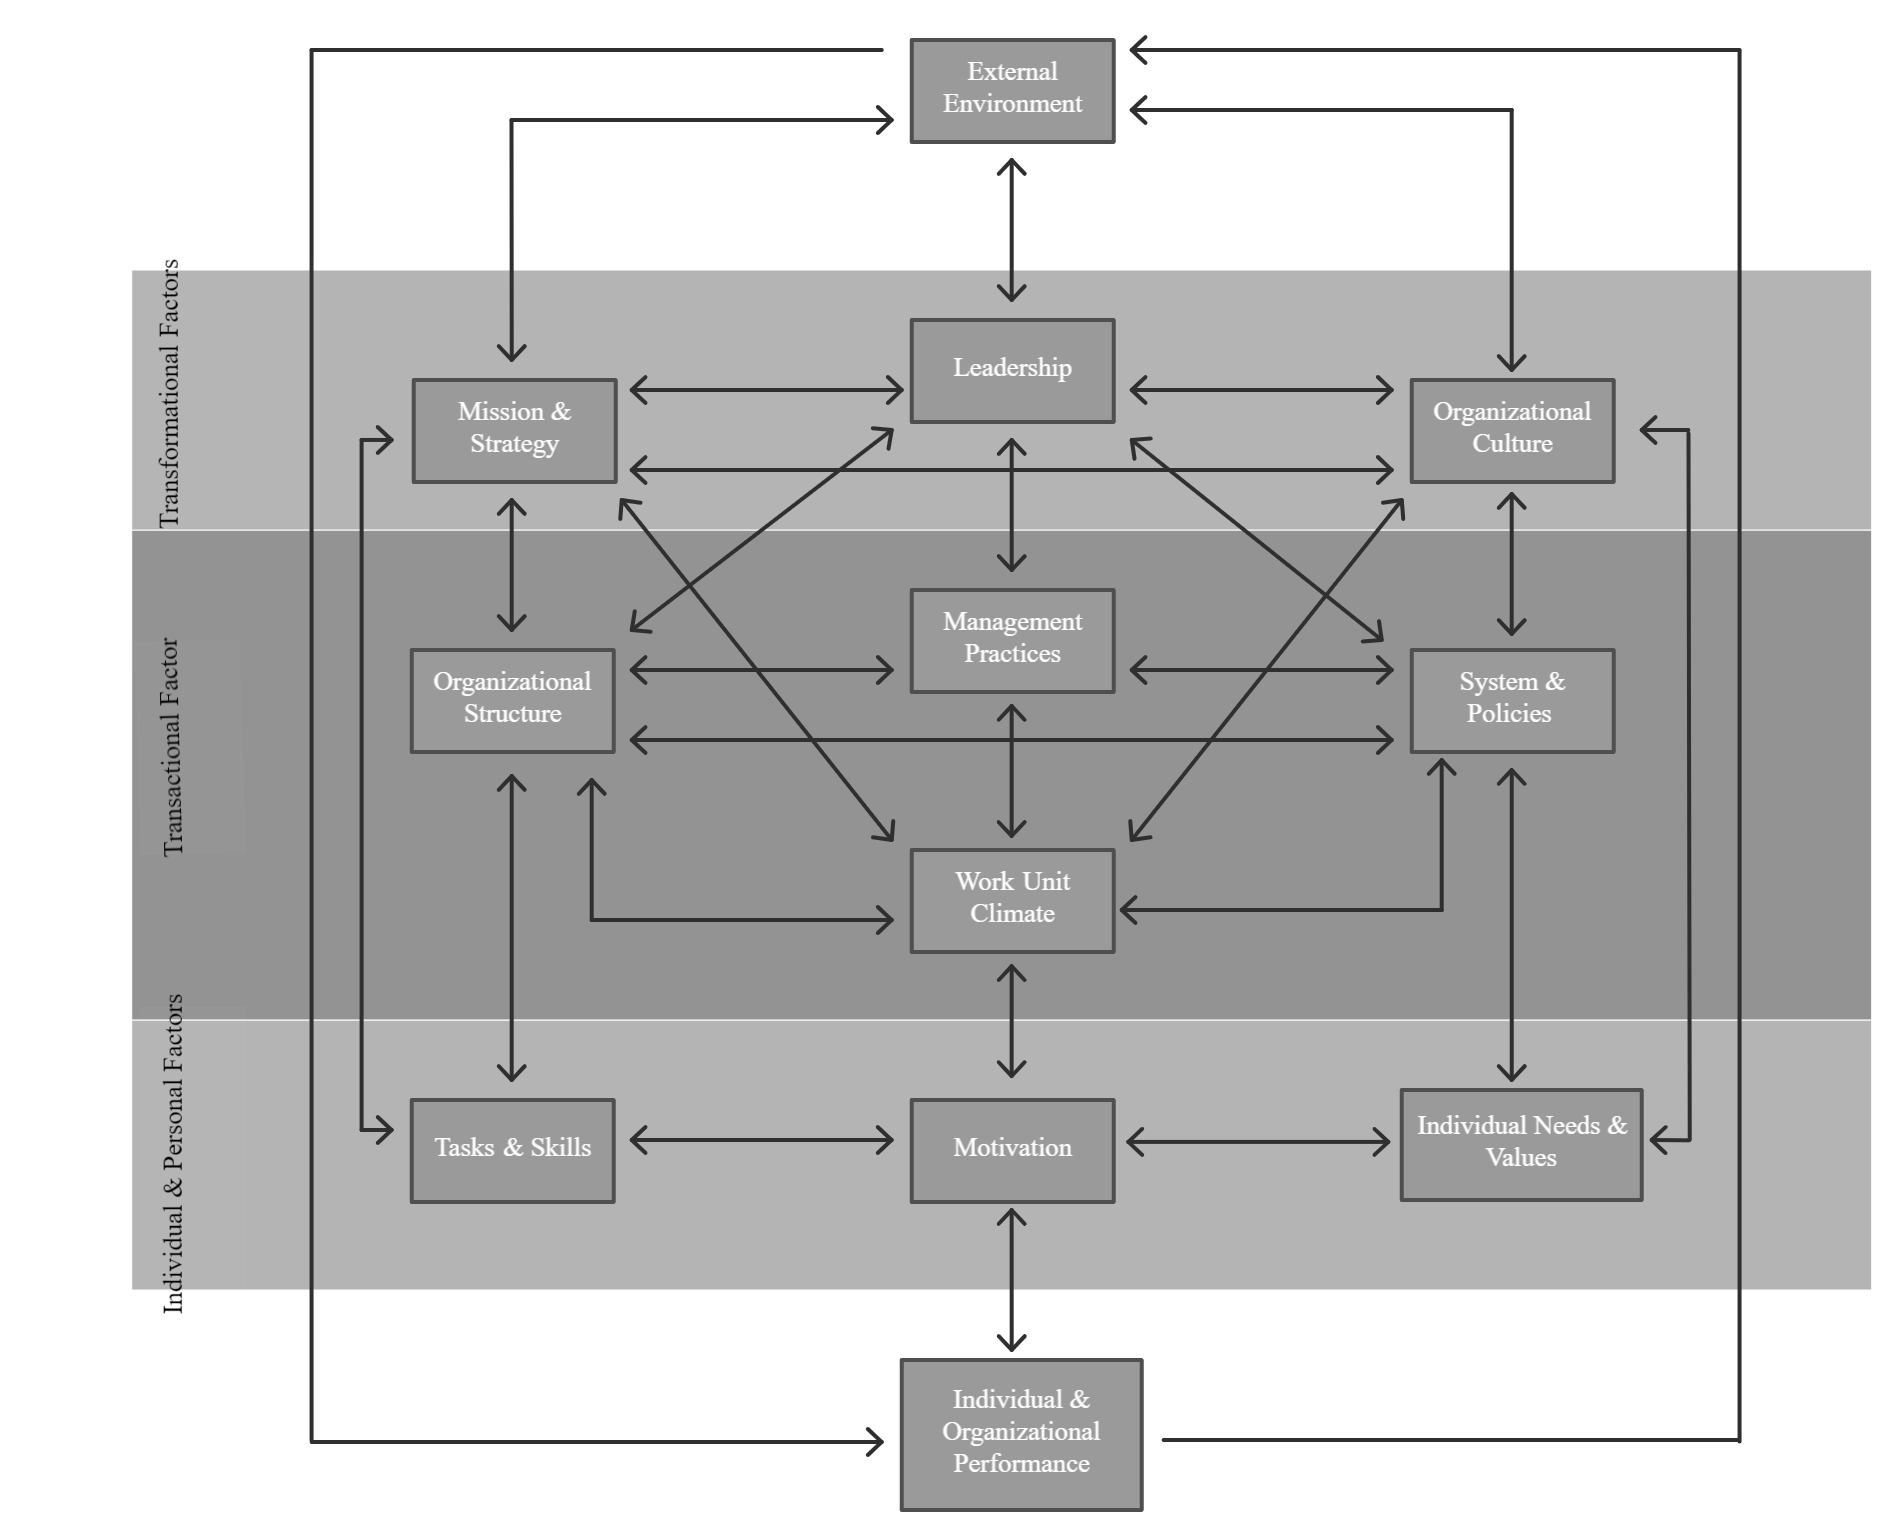
How to apply it:
- Find out where the need for change is coming from; whether from the external environment, transformational factors etc.
- Identify which of the elements in each group is responsible for the situation
- Examine the key element along with the other 11 elements; pay special attention to those that are closely linked to the identified element
- Figure out the changes you need to make to the main element along with the other few elements it is closely linked to
