
Collecting Data– Six Sigma data collection is the most significant part of the entire process. It is imperative to have very detailed, sophisticated, and consistent tools or methods to help in collecting or gathering the necessary data.
Everyone needs to be on the same page when gathering raw data because the Six Sigma Process is one that is deeply rooted in a teamwork philosophy. Usually Green and Yellow Belts collect data who pass it on to higher-level Master Black Belts and Black Belts who analyze it.
The common tools for collecting data are:
-
- Operational Definitions Sheet: This sheet is used to help maintain the consistency over the whole process of data collection.
-
- VOC or Voice of the Customer Data Collection Tool: One of the next tools that can be invaluable in the raw metric collection process. Raw information from customers is gathered using methods of databases, interviews, observations, surveys and so-called listening posts. All the information gathered is input into this tool to help keep things organized as well as to aid in overall analysis.
- Check Sheet: Six Sigma Check sheets allow for the collection of smaller amounts of sample information. This data is generally utilized to check to see if planned or projected outcomes have been achieved and to monitor overall progress towards a goal. The Check Sheets are one of the most important tools to be used in the entire process.
- Data Sheets: These are used to help define problems; detailing and substantiating the outcome of certain procedures. While one could include this information in the former, it is wiser to separate the information to keep confusion to a minimum as well as to make research easier in the future when tracking progress and problems in the system.
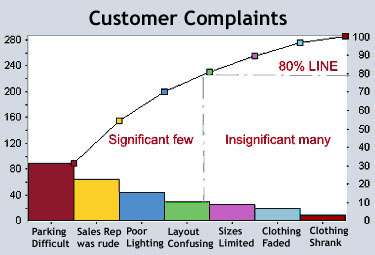
- Pareto Chart: This identifies which processes consume most of the problems while only producing the least amount of profitable outcomes. The Pareto Principle or eighty-twenty rule states that usually eighty percent of the effects of a process come from about twenty percent of the causes. It helps the team concentrate eighty percent of their efforts on the twenty percent that produces results as opposed to the other way around, as is the typical business process.
Example of Pareto Chart
Apply for Six Sigma Black Belt Certification Now!!
http://www.vskills.in/certification/Certified-Six-Sigma-Black-Belt-Professional