A cause and effect modeling is done to uncover patterns in data of the business organizations.
There are many different types of causal patterns in the world. Below are six patterns that are embedded in many concepts. Causality in the real world seldom falls into one neat pattern or another. The patterns often work together or different parts of a system entail different patterns—making the causality even more complex!
- Linear Causality – Cause precedes effect; sequential pattern. Direct link between cause and effect. Has a clear beginning and a clear ending. Effect can be traced back to one cause. One cause and one effect; additional causes or effects turn this pattern into domino causality
- Domino Causality – Sequential unfolding of effects over time. An extended linear pattern that results in direct and indirect effects. Typically has a clear beginning and a clear ending. Can be branching where there is more than one effect of a cause (and these may go on to have multiple effects and so on.). Branching forms can be traced back to “stem” causes. Anticipating outcomes involves deciding how far to trace effects. Short-sightedness can lead to unintended effects.
- Cyclic Causality – One thing impacts another which in turn impacts the first thing (or alternatively impacts something else which then impacts something else and so on, but eventually impacts the first thing). Involves a repeating pattern. Involves feedback loops. May be sequential or may be simultaneous. Typically no clear beginning or ending (Sometimes you can look back in time to a beginning but often that results in the classic ‘which came first, the chicken or the egg’ problem.).
- Spiraling Causality – One thing impacts another which in turn impacts the first thing (or alternatively impacts something else which then impacts something else and so on, but eventually impacts the first thing) with amplification or de-amplification of effects. Involves feedback loops. It is sequential as each event is a reaction to the one before it. Often a clear beginning and ending. It is difficult to anticipate outcomes of later feedback loops during earlier feedback loops.
- Relational Causality – Two things work in relation to each other to cause an outcome. It often involves two variables in comparison to each other. There may be a relationship of balance, equivalence, similarity or there may be a relationship of difference. If one thing changes, so does the relationship, therefore so does the outcome. If two things change but keep the same relationship, the outcome doesn’t change.
- Mutual Causality – Two things impact each other. The impact can be positive for both, negative for both, or positive for one and negative for the other. The causes and effects are often simultaneous, but can be sequential. May be event-based or may be a relationship over time (such as the moss and the algae in lichen).

A cause and effect analysis is an attempt to understand why things happen as they do. People in many professions—accident investigators, scientists, historians, doctors, newspaper reporters, automobile mechanics, educators, police detectives—spend considerable effort trying to understand the causes and effects of human behavior and natural phenomena to gain better control over events and over ourselves. If we understand the causes of accidents, wars, and natural disasters, perhaps we can avoid them in the future. If we understand the consequences of our own behavior, perhaps we can modify our behavior in a way that will allow us to lead happier, safer lives.
| Cause | Effect |
| ü Earthquakes ü Erosion ü Heavy Rain ü Poor Drainage ü Deforestation ü Steep Terrain | Mudslides |
| Mudslides | ü Flooding ü Property Loss ü Injury and Death |
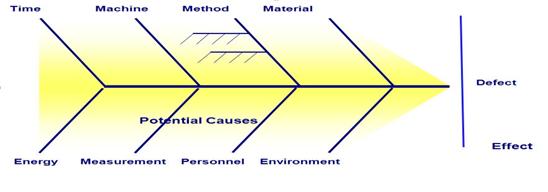
Cause and Effect Diagram
It helps uncover potential root causes by providing structure to cause identification effort. It is also called as fishbone or Ishikawa diagram. It helps in ensuring new ideas being generated during brainstorming by not overlooking any major possible cause.
It should be used for cause identification after clearly defining the problem. It is also useful as a cause—prevention tool by brainstorming ways to maintain or prevent future problems.
Developing Cause and Effect Diagram – It involves the following steps
- Name the problem or effect of interest. Be as specific as possible.
- Write the problem at the head of a fishbone “skeleton”
- Decide the major categories for causes and create the basic diagram on a flip chart or whiteboard.
- Typical categories include the manpower, machines, materials, methods, measurements and environment
- Brainstorm for more detailed causes and create the diagram either by working through each category or open brainstorming for any new input.
- Write suggestions onto self-stick notes and arrange in the fishbone format, placing each idea under the appropriate categories.
- Review the diagram for completeness.
- Eliminate causes that do not apply
- Brainstorm for more ideas in categories that contain fewer items
- Discuss the final diagram. Identify causes which are most critical for follow-up investigation.
They break problems down into small-size pieces and displays possible causes in a graphical manner. They display how various causes interact with each other and uses brainstorming rules when generating ideas. A fishbone diagram development consists of brainstorming, prioritizing and development of an action plan.
