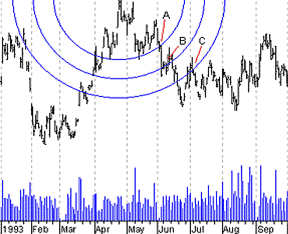
Fibonacci Arcs are displayed by first drawing a trend line between two extreme points, for example, a trough and opposing peak. Three arcs are then drawn, centered on the second extreme point, so they intersect the trend line at the Fibonacci levels of 38.2%, 50.0%, and 61.8%.
The interpretation of Fibonacci Arcs involves anticipating support and resistance as prices approach the arcs. A common technique is to display both Fibonacci Arcs and Fibonacci Fan Lines and to anticipate support/resistance at the points where the Fibonacci studies cross.
Note that the points where the Arcs cross the price data will vary depending on the scaling of the chart, because the Arcs are drawn so they are circular relative to the chart paper or computer screen.
The following chart illustrates how the arcs can provide support and resistance (points “A,” “B,” and “C”).

Apply for Technical Analysis Certification Now!!
http://www.vskills.in/certification/Certified-Technical-Analyst

