Work Management or Work activity management (WAM) is the process of creating, delegating and tracking the progress of multiple tasks to completion. It is the next step in the form of project management, which is described as “the discipline of organizing and managing resources in such a way that these resources deliver all the work required to complete a project within defined scope, time, and cost constraints”. WAM systems and software are an emerging set of complementary tools aimed at helping managers and employees accomplish their work goals.
Tracking the progress of multiple tasks and projects is becoming increasingly complex as organizations grow, both internally (growing employee numbers, responsibilities) and externally (multiple locations, remote employees). WAM systems allow for the delegation of duties and create an easily accessible format for ensuring work is completed in an allotted time frame.
Scheduling is the process of arranging, controlling and optimizing work and workloads in a production process or manufacturing process. Scheduling is used to allocate plant and machinery resources, plan human resources, plan production processes and purchase materials.
- Forward scheduling is planning the tasks from the date resources become available to determine the shipping date or the due date.
- Backward scheduling is planning the tasks from the due date or required-by date to determine the start date and/or any changes in capacity required.
A key character of scheduling is the productivity, the relation between quantity of inputs and quantity of output. Key concepts here are:
- Inputs : Inputs are plant, labor, materials, tooling, energy and a clean environment.
- Outputs : Outputs are the products produced in factories either for other factories or for the end buyer. The extent to which any one product is produced within any one factory is governed by transaction cost.
- Resource allocation : Resource allocation is assigning inputs to produce output. The aim is to maximize output with given inputs or to minimize quantity of inputs to produce required output.
Schedules can usefully span both short periods, such as a daily or weekly schedule, and long-term planning with respect to periods of several months or years. They are often made using a calendar, where the person making the schedule can note the dates and times at which various events are planned to occur. Schedules that do not set forth specific times for events to occur may instead list algorithmically an expected order in which events either can or must take place.
Various techniques used are Gantt and CPM/PERT charts
Gantt Chart
It is a graphical chart, showing the relationships amongst the project tasks, along with time constraints. The horizontal axis of a Gantt chart shows the units of time (days, weeks, months, etc.). The vertical axis shows the activities to be completed. Bars show the estimated start time and duration of the various activities. A Gantt chart shows what has to be done (the activities) and when (the schedule) as shown in the figure below
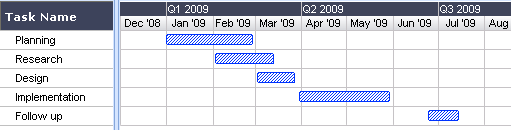
Milestone Charts – Gantt charts are often modified in a variety of ways to provide additional information. One common variation is milestone charts. The milestone symbol represents an event rather than an activity; it does not consume time or resources.
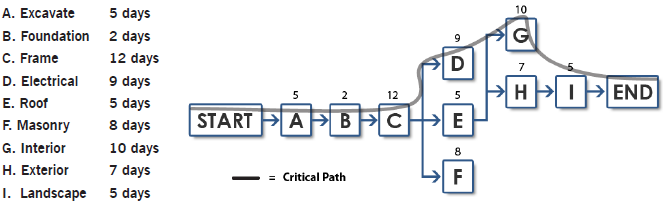
CPM/PERT Chart
CPM or “Critical Path Method” – It is a tool to analyze project and determine duration, based on identification of “critical path” through an activity network. The knowledge of the critical path can permit project managers to change duration. It is a project modeling technique developed in 1950s and is used with all forms of projects. It displays activities as nodes or circles with known activity times.
CPM is a diagram showing every step of the project, as letters with lines to each letter representing the sequence in which the project steps take place. A list of activities is required to complete the project and the time (duration) that each activity will take to complete, along with the sequence and dependencies between activities. CPM lays out the longest path of planned activities to the end of the project as well as the earliest and latest that each activity can start and finish without delaying other steps in the project. The project manager can then, determine which activities in the project need to be completed before others and how long those activities can take before they delay other parts of the project. They also get to know which set of activities is likely to take the longest, also called as the critical path which is also the shortest possible time period in which the project can be completed.
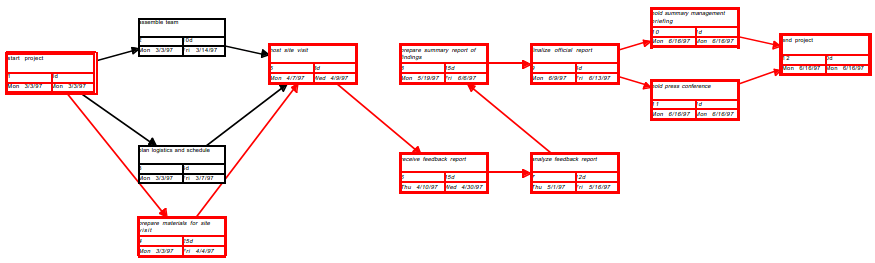
PERT Chart – A PERT chart (program evaluation review technique) is a form of diagram for CPM that shows activity on an arrow diagram. PERT charts are more simplistic than CPM charts because they simply show the timing of each step of the project and the sequence of the activities. In PERT, estimates are uncertain and ranges of duration and the probability that activity duration will fall into that range is taken whereas CPM is deterministic.
A PERT chart is a graphic representation of a project’s schedule, showing the sequence of tasks, which tasks can be performed simultaneously, and the critical path of tasks that must be completed on time in order for the project to meet its completion deadline. The chart can be constructed with a variety of attributes, such as earliest and latest start dates for each task, earliest and latest finish dates for each task, and slack time between tasks. A PERT chart can document an entire project or a key phase of a project. The chart allows a team to avoid unrealistic timetables and schedule expectations, to help identify and shorten tasks that are bottlenecks, and to focus attention on most critical tasks. It is most useful for planning and tracking entire projects or for scheduling and tracking the implementation phase of a planning or improvement effort.
Developing PERT Chart
- Identify all tasks or project components – Ensure the team has knowledge of the project so that during the brainstorming session all component tasks needed to complete the project are captured. Document the tasks on small note cards.
- Identify the first task that must be completed – Place the appropriate card at the extreme left of the working surface.
- Identify any other tasks that can be started simultaneously with task #1 – Align these tasks either above or below task #1 on the working surface.
- Identify the next task that must be completed – Select a task that must wait to begin until task #1(or a task that starts simultaneously with task #1) is completed. Place the appropriate card to the right of the card showing the preceding task.
- Identify any other tasks that can be started simultaneously with task #2 – Align these tasks either above or below task #2 on the working surface.
- Continue this process until all component tasks are sequenced.
- Identify task durations – Reach a consensus on the most likely amount of time each task will require for completion. Duration time is usually considered to be elapsed time for the task, rather than actual number of hours/days spent doing the work. Document this duration time on the appropriate task cards.
- Construct the PERT chart – Number each task, draw connecting arrows, and add task characteristics such as duration, anticipated start date, and anticipated end date.
- Determine critical path – The project’s critical path includes those tasks that must start or finish on time to avoid delays to the total project. Critical paths are typically displayed in red.
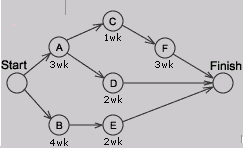
Activity Network Diagram
It charts the flow of activity between separate tasks and graphically displays interdependent relationships between groups, steps, and tasks as they all impact a project. Bubbles, boxes, and arrows are used to depict these activities and the links between them. It shows the sequential relationships of activities using arrows and nodes to identify a project’s critical path. It is similar to the CPM/ PERT and also called as arrow diagram.
Developing Activity Network Diagram – Development starts with compiling a list of tasks essential for completion of the project. These tasks are then arranged in a chronological order, depending on the project considering inter-task dependency. All tasks are placed in a progressing line with tasks that can be done simultaneously, is placed on parallel paths, whereas jobs that are dependent should be placed in a chronological line. Apply realistic estimate to each task then, enlist the critical path.