These icons are essential for mapping and development of VSM. They include
| Icon | Name | Description |
 | Customer/Supplier | It represents outside sources. It represents the supplier when placed in the upper-left, and the customer when placed in the upper-right. |
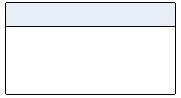
 | Process | It is a process box with operator. The process or activity name is listed in the top bar, and the department or function name in the center area. It may represent a process, operation, department, or other activity involved in material flows. |
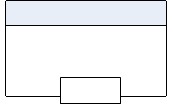
 | Production Control | It is a process box; an area where value can be added to a product. The process or activity name is listed in the top bar, and the department or function name in the center area. It is a shared process operation or department. It includes estimates for the number of operators required, for the value stream. |
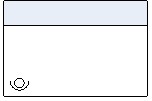
 | Process Box with Information Technology | Process or activity name in the top bar, Department or function name in the center area. Note the information technology used to assist in the processing of information in the lower-left corner. If largely or completely manual, may indicate “manual” or “manual” plus the information technology used. |
 | Data Table | This data box is placed under other icons that have information required for analyzing the system. It typically includes Cycle Time (Process Time, Lead Time), Changeover Time, and other processing information. |
| | Information Box | Text box for including relevant information only as needed. |
| | Physical Pull | This is a withdrawal of materials from a supermarket. |
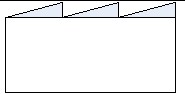
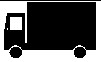 | Shipment Truck | This represents shipments using external transport from a supplier. It may be labeled with the frequency of shipment. |
 | Inventory | This is a material Queue of products that are not being processed. It represents storage of raw materials as well as finished goods. The time period may be listed below the icon. |
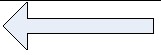
| | Push Arrow | It represents a push of information or material from one process to another. A process produces something regardless of the downstream needs. |
| | Manual Information | This arrow indicates manual flow of information. |
| | Electronic Information | This shape represents electronic flow of information. |
| | Pull Arrow | This indicates that a customer or process pulls from a previous process. |
 | Shipment or Materials Movement Arrow | This represents material or product flow from supplier to process or from process to customer. Supplier to process flow top to bottom; process to customer flows bottom to top. |
