Assessing credit risk entails the calculation of the probability of a counterparty defaulting in full, or in part, on its obligation. The credit decision can be seen in terms of the basic risk management model. This involves a decision either
- to extend credit, which provides a reward but entails a risk, or
- to refuse credit.
The situation facing the credit manager is displayed as a decision problem in the figure below. The requirement is to balance the gain from taking the credit risk by extending credit against the potential loss. In the decision problem the alternative ‘B’ is to refuse credit and not obtain any reward.
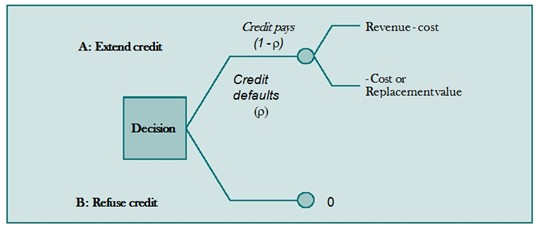
Figure: The credit decision as a decision problem
The above structure shows the gain if no default happens against the potential loss from extending credit based on the likelihood that default takes place, and the amount that is lost if the credit defaults. The probability that the credit defaults is depicted as (r).
The outcome from this scenario will be one of two possibilities. Either the credit will performs according to expectations, or the credit will default. If the credit defaults the cost to the credit manager will be the cost or the replacement value for what has not been provided.
For example, when deciding whether to provide trade credit a firm faces the following decisions:
to which applications to proceed with;
- what limit to set on the amount of credit extended;
- whether this needs to be modified over time;
- what action should be taken if there is a delay in repayment;
- which counterparties should be actively solicited for business.
Although the nature of the credit analysis decision can be readily described, the steps required to effectively manage the process are more complicated. The premise of all the credit risk problems relate to the risk that counterparties will not honour their obligations during maturity.
To determine which counterparty may default, the methods include the use of deterministic, or relationship models, or statistical modeling to classify credit quality and predict likely default frequency. After the evaluation process, the amount of risk to be taken can then be determined.
The effect of credit exposure is calculated by the cost of replacing the cash flows if the other party defaults. Losses only ocurr from failure to pay, but also from credit risk when credit rating agencies downgrade firms. When securities are being traded, there may be a decrease in their market value. Going further, when there is transaction is cross-border, country risk needs to be considered in the risk assessment.
One important area for the use of expert systems is in financial analysis. This is the process of examining the financial statements of a firm with a view to understanding the nature, activity and risks that are inherent in the business. To address the major elements of financial risk associated with a company, a good set of financial records is mandatory. These records provide the needed information to evaluate past performance and plan future strategies through a set of specific financial statements. Financial statements provide the basis to monitor the financial position, control expenditures, and measure various aspects of the financial performance of the business. The essential financial statements are the balance sheet, statement of owner’s equity, income statement and cash flow statement.
Balance Sheet: The balance sheet or net worth statement is a snapshot of the financial position of a business on a specific date. It shows the value of all assets which is “balanced” between the value of all liabilities or the claims of others against the business and the net worth or the owner’s claims against the business. In agriculture both assets and liabilities are separated into current, intermediate and long term or fixed. Some analysts use only current and noncurrent categories for describing assets and liabilities. Current assets are cash or any asset such as grain or marketing livestock which will be converted into cash within a year. Current liabilities are any debts or payments that are due within a year. Intermediate assets typically include breeding livestock and machinery. Land is the major component in the long term category. Intermediate and long term liabilities are debts against the corresponding assets. Payments on any class of liabilities due within the year are part of current liabilities.
Often two sets of balance sheets are maintained, one using market value of assets and the other with cost values. The cost value approach measures the contribution of management to the growth of equity over time because it removes the impacts of inflation and deflation.
Income Statement: The income statement, or profit and loss (P&L) statement, shows the net income for the business during the accounting period. It includes income generated, the operating and overhead costs, depreciation on assets, gains or losses on disposal of capital assets and income and expenses. It can be prepared on a cash or accrual basis. The accrual approach provides a true picture of the profitability of the business for that period by accounting for changes in the value of inventories, payables and receivables.
Statement of Owner’s Equity: The equity position over time measures the financial growth and progress of the business. Changes can occur due to retained earnings, withdrawals and contributions, changes in the market value of assets or changes in personal net worth from sources. It formally links together the beginning and ending balance sheets for the year and the corresponding income statement. This process reconciles the two statements and shows the impact of the withdrawals for family living costs.
Cash Flow Statement: Effective financial control of the business requires thorough knowledge of the sources and uses of cash in the business. A business may have both a strong balance sheet and income statement but the cash needs and commitments may not match the cash inflows. The cash flow statement can be a statement of past activities or a budget of expected cash inflows and outflows. As a statement of past performance, a cash flow statement shows how and when cash was generated and used to pay for inputs, loan payments, family living and any capital purchases. A projected cash flow is essential for evaluating the borrowing needs of a business and the feasibility of repayment plans.
A cash flow statement shows a complete accounting of debt transactions including principal and interest payments as well as the proceeds from new loans. An income statement only shows interest payments. Other items included in a complete cash flow but not in an income statement include family living costs, income and expenses, and income taxes.
Assessing and Managing Financial Risk Using Financial Performance Measures
The main financial risk factors are related to liquidity, solvency, profitability and repayment capacity of the business. The first two are based on data from the balance sheet, profitability measures come from the income statement and repayment capacity comes from cash flow information.
Financial Ratios
Financial ratios relating items in income statement to total assets in the balance sheet are calculated. About 20 ratios are used to appraise the performance of a bank. The financial ratios are calculated as a percent to total assets. They are:
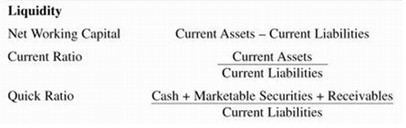
Liquidity Ratios: Liquidity is the ability of a business to meet financial obligations as they come due without disrupting the normal operations of the business including paying living expenses, taxes and debt payments.
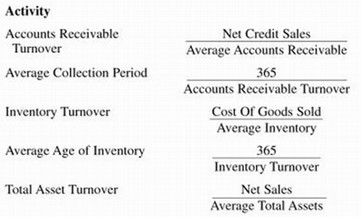
Activity Ratios: the liquidity of specific assets and the efficiency of managing assets.
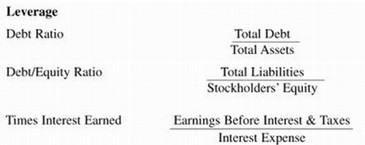
Leverage Ratios: This is the firm’s ability to meet cash needs as they arise.
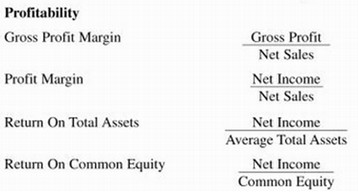
Profitability Ratios: the overall performance of the firm and its efficiency in managing investment (assets, equity, capital).
Debt Ratios: – the extent of a firm’s financing with debt relative to equity and its ability to cover fixed charges.
Other key ratios commonly used by bank analysts for evaluation of different dimensions of financial performance are
- capitalization
- asset quality
- operating efficiency
- liquidity
- interest sensitivity
Profit Ratios
Return on Equity (ROE), Return on Assets (ROA), profit margin, asset utilization and net interest margin are profit ratios.
- ROE indicates the rate of return on equity capital and is particularly on equity capital significant in the context of objective of maximization of share value. Equity is the sum of share capital, preferred shares, paid-in surplus, retained earnings and reserves for future contingencies.
Rate of Return Equity % = [Net income/Total equity capital] × 100
- Return on Assets (ROA) measures the ability of management to utilize the real and financial resources of the bank to generate income and is used to evaluate management.
Rate of Return Assets % = [Net income/Total assets] × 100
- The relationship between ROE and ROA is
ROE = ROA × Equity multiplier (financial leverage)
[Net income/Total equity] = [Net income/Total assets] × [Net assets/Total equity]
- Return on equity is a product of ROA and equity or leverage multiplier. A high equity multiplier can increase both ROE and the growth rate of the bank as long as ROA is positive. ROA is the product of profit margin and asset utilization.
ROE = Profit margin × asset utilization × equity multiplier.
[Net income/Total equity] = [Net income/Operating income] × [Operating income/Total assets] × [Total assets/Total equity]
- Return on assets is also a product of profit margin and asset utilization ratio. Profit margin is determined given the operating income by the ability to control expenses; and asset utilization ratio on the effective employment of assets to generate revenues.
- Net Interest Margin (NIM) gives an insight into the bank’s financial performance because interest income and expenses absorb a major share of total operating income and expenses.
Net interest margin % = [(Total interest income –Total interest expense)/Average earning assets] × 100
Non-performing Assets
Non-performing assets equal the sum of non-accrual loans and restructured loans. Non-accrual loans are those whose cash flows stream is so uncertain that the bank does not recognize income until cash is received. Non-performing assets are a result of the compromise of the objectivity of credit appraisal and assessment.
The problem is aggravated by the weaknesses in the accounting, disclosure and legal frameworks. In the assessment of the status of current loans, the borrower’s creditworthiness and the market value of collateral are not taken account rendering it difficult to spot bad loans.
