Two-sample hypothesis testing is statistical analysis designed to test if there is a difference between two means from two different populations. For example, a two-sample hypothesis could be used to test if there is a difference in the mean salary between male and female doctors in the New York City area.
A two-sample hypothesis test could also be used to test if the mean number of defective parts produced using assembly line A is greater than the mean number of defective parts produced using assembly line B. Similar to one-sample hypothesis tests, a one-tailed or two-tailed test of the null hypothesis can be performed in two-sample hypothesis testing as well. The two-sample hypothesis test of no difference between the mean salaries of male and female doctors in the New York City area is an example of a two-tailed test. The test of whether or not the mean number of defective parts produced on assembly line A is greater than the mean number of defective parts produced on assembly line B is an example of a one-tailed test.
Example using Excel
Big Foods Grocery has two grocery stores located in Johnston City. One store is located on First Street and the other on Main Street and each is run by a different manager. Each manager claims that her store’s layout maximizes the amounts customers will purchase on impulse. Both managers surveyed a sample of their customers and asked them how much more they spent than they had planned to, in other words, how much did they spend on impulse? The following table shows the sample data collected from the two stores.
| First Street | Main Street |
| 15.78 | 15.19 |
| 17.73 | 18.22 |
| 10.61 | 15.38 |
| 15.79 | 15.96 |
| 14.22 | 21.92 |
| 13.82 | 12.87 |
| 13.45 | 12.47 |
| 12.86 | 13.96 |
| 10.82 | 13.79 |
| 12.85 | 13.74 |
| 18.4 | |
| 18.57 | |
| 17.79 | |
| 10.83 |
Upper-level management at Big Foods Grocery wants to know if there is a difference in the mean amounts purchased on impulse at the two stores and has hired you to perform the statistical analysis. This question can be addressed by performing a two-sample test of a hypothesis. The following describes the steps to perform the test in Excel.
Step 1. The first step is to state the hypothesis to be tested, called the null hypothesis, and the alternative hypothesis. In this example, upper-level management wants to know if there is a difference in the mean amounts purchased on impulse at the two stores. An alternative way to state this question is “Is the mean amount purchased on impulse at the First Street store equal to the mean amount purchased at the Main street store?” Recall that the “equality” part of the hypothesis is always stated in the null hypothesis. Therefore, the null and alternative hypotheses for this example are:
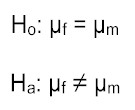
where μf is the mean amount spent on impulse in the First Street store and μm is the mean amount spent on impulse in the Main Street store. Note, this is a two-tailed test of a hypothesis.
Step 2. Select the level of significance to be used in the test. The level of significance is the probability of rejecting the null hypothesis when it is true. Common significance levels are .10, .05, and .01. Suppose you chose a .05 level of significance, meaning there is a 5% chance that you will reject the null hypothesis when it is true.
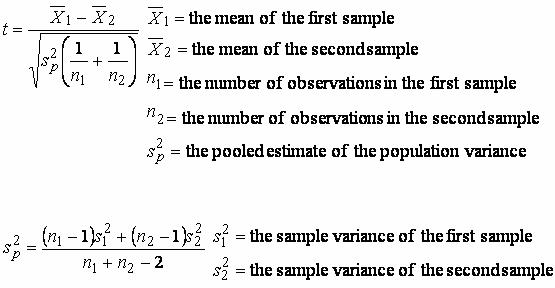
Step 3. Select the test statistic that is appropriate for this test. In general, you will need to decide between using a z test statistic or a t test statistic. If one or more of the sample sizes is less than 30 (as in this problem), a t statistic is appropriate. The test statistic for this example is:
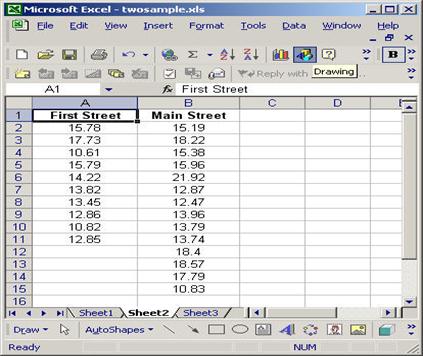
Determine the rejection region. The rejection region defines the conditions under which the null hypothesis is rejected. The critical values for this test are based on degrees of freedom, and in this problem the degrees of freedom are equal to 22 (10 + 14 – 2). The critical t values are -2.074 and 2.074. Therefore, if the test statistic is less than -2.074 or greater than 2.074, we will reject the null hypothesis in favor of the alternative. Perform the hypothesis test. The above calculations are easily computed in Excel. First, input the data into an Excel spreadsheet:
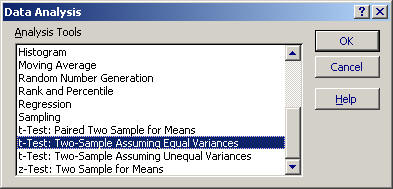
From the Tools pull-down menu, select Data Analysis, and then select t-Test: Two-Sample Assuming Equal Variances.
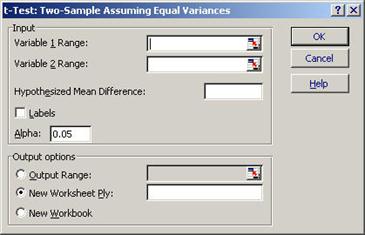
Click OK in the Data Analysis window and the t-Test: Two-Sample Assuming Equal Variances window opens.
In the Variable 1 Range field, type A2:A11, or click the worksheet icon to the right of the Variable 1 Range field and click and drag the cursor over the data in column A. In the Variable 2 Range field, type B2:B15, or click the worksheet icon to the right of the Variable 2 Range field and click and drag the cursor over the data in column B. In the Hypothesized Mean Difference field type 0 and in the Output Options box, type D1 in the Output Range field. The t-Test: Two-Sample Assuming Equal Variances window should appear as follows
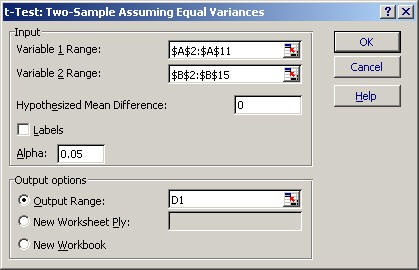
Click OK in the t-Test: Two-Sample Assuming Equal Variances window and the results of the hypothesis test appear:
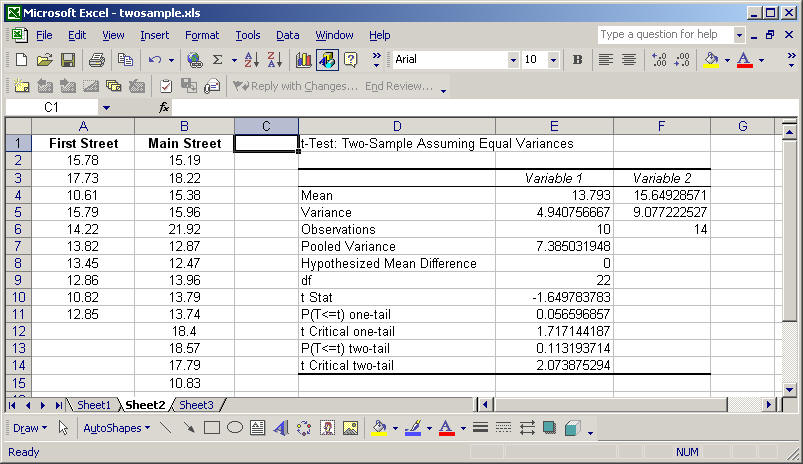
The results of the two-sample test are shown above. Excel calculates the test statistic and critical values for the test. Recall that if the test statistic is less than -2.074 or greater than 2.074, we reject the null hypothesis in favor of the alternative. The test statistic is -1.649, which does not fall into the rejection region, so we fail to reject the null hypothesis of no difference between the means from the two samples. In other words, we fail to reject that the mean amount spent on impulse at the First Street grocery store is equal to the mean amount spent on impulse at the Main Street grocery store with 95% confidence.
