Time series methods use historical data as the basis of estimating future outcomes.
Moving Average
A moving average (rolling average or running average) is a calculation to analyze data points by creating a series of averages of different subsets of the full data set. It is also called a moving mean (MM) or rolling mean and is a type of finite impulse response filter. Variations include: simple, and cumulative, or weighted forms (described below).
Given a series of numbers and a fixed subset size, the first element of the moving average is obtained by taking the average of the initial fixed subset of the number series. Then the subset is modified by “shifting forward”; that is, excluding the first number of the series and including the next number following the original subset in the series. This creates a new subset of numbers, which is averaged. This process is repeated over the entire data series. The plot line connecting all the (fixed) averages is the moving average. A moving average is a set of numbers, each of which is the average of the corresponding subset of a larger set of datum points. A moving average may also use unequal weights for each datum value in the subset to emphasize particular values in the subset.
A moving average is commonly used with time series data to smooth out short-term fluctuations and highlight longer-term trends or cycles. The threshold between short-term and long-term depends on the application, and the parameters of the moving average will be set accordingly. For example, it is often used in technical analysis of financial data, like stock prices, returns or trading volumes. It is also used in economics to examine gross domestic product, employment or other macroeconomic time series. Mathematically, a moving average is a type of convolution and so it can be viewed as an example of a low-pass filter used in signal processing. When used with non-time series data, a moving average filters higher frequency components without any specific connection to time, although typically some kind of ordering is implied. Viewed simplistically it can be regarded as smoothing the data.
Exponential Smoothing
Exponential smoothing is a technique that can be applied to time series data, either to produce smoothed data for presentation, or to make forecasts. The time series data themselves are a sequence of observations. The observed phenomenon may be an essentially random process, or it may be an orderly, but noisy, process. Whereas in the simple moving average the past observations are weighted equally, exponential smoothing assigns exponentially decreasing weights over time.
Exponential smoothing is commonly applied to financial market and economic data, but it can be used with any discrete set of repeated measurements. The simplest form of exponential smoothing should be used only for data without any systematic trend or seasonal components
The raw data sequence is often represented by {xt} beginning at time t=0, and the output of the exponential smoothing algorithm is commonly written as {st}, which may be regarded as a best estimate of what the next value of x will be. When the sequence of observations begins at time t = 0, the simplest form of exponential smoothing is given by the formulae
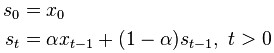
where α is the smoothing factor, and 0 < α < 1.
Extrapolation
Extrapolation is the process of estimating, beyond the original observation range, the value of a variable on the basis of its relationship with another variable. It is similar to interpolation, which produces estimates between known observations, but extrapolation is subject to greater uncertainty and a higher risk of producing meaningless results. Extrapolation may also mean extension of a method, assuming similar methods will be applicable. Extrapolation may also apply to human experience to project, extend, or expand known experience into an area not known or previously experienced so as to arrive at a (usually conjectural) knowledge of the unknown (e.g. a driver extrapolates road conditions beyond his sight while driving). The extrapolation method can be applied in the interior reconstruction problem.
Trend Estimation
It is a statistical technique to aid interpretation of data. When a series of measurements of a process are treated as a time series, trend estimation can be used to make and justify statements about tendencies in the data, by relating the measurements to the times at which they occurred. By using trend estimation it is possible to construct a model which is independent of anything known about the nature of the process of an incompletely understood system (for example, physical, economic, or other system). This model can then be used to describe the behaviour of the observed data.
In particular, it may be useful to determine if measurements exhibit an increasing or decreasing trend which is statistically distinguished from random behaviour. Some examples are determining the trend of the daily average temperatures at a given location from winter to summer, and determining the trend in a global temperature series over the last 100 years. In the latter case, issues of homogeneity are important (for example, about whether the series is equally reliable throughout its length).
Growth Curve
A growth curve is an empirical model of the evolution of a quantity over time. Growth curves are widely used in biology for quantities such as population size or biomass (in population ecology and demography, for population growth analysis), individual body height or biomass (in physiology, for growth analysis of individuals). Values for the measured property can be plotted on a graph as a function of time; see Figure 1 for an example.
Growth curves are employed in many disciplines besides biology, particularly in statistics, which has an extensive literature on growth curves. In mathematical statistics, growth curves are often modeled as being continuous stochastic processes, e.g. as being sample paths that almost surely solve stochastic differential equations.
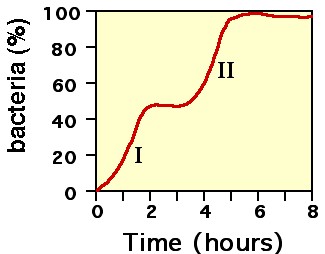
A bi-phasic bacterial growth curve.
