Process of Inspecting Elements in Browser
Learning about the process of inspecting Elements in Browser is not a very difficult task. Indeed, we cannot get all the information on the front end of the web page. But if you really want to know what is happening, then you must know how to open any web page to inspect the elements. In general, some of the features you can find about web page by inspecting the page usually includes – style, ids of a web element. Although, the HTML information of any element can be found by clicking on Element. Here, Web browsers provided tools to inspect web elements of a web page. Plug-ins like Firebug also provides same functionality.
We will now discuss at length about the various elements in a web browser and their functionality.
Inspecting Elements in Chrome DevTools
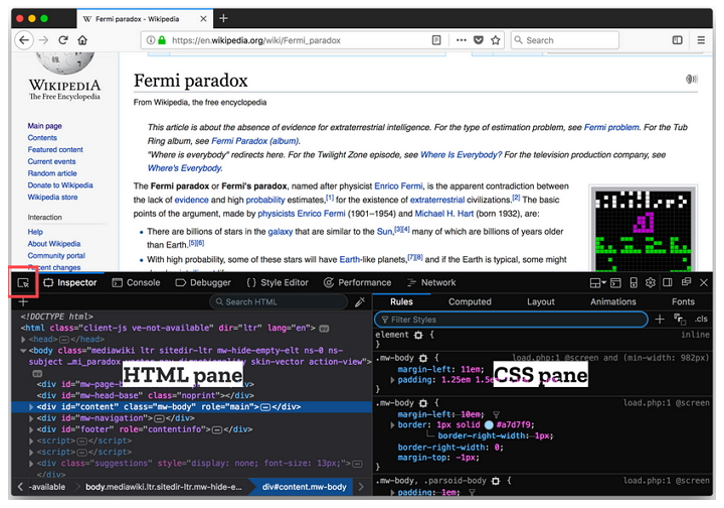
For inspecting Elements in browser like Chrome, we have Chrome Developer Tools (also known as DevTools). These are a set of web authoring and debugging tools built into Google Chrome. Here, the DevTools provide web developers deep access into the internals of the browser and their web application. Primarily, the DevTools are used to efficiently track down layout issues, set JavaScript breakpoints, and get insights for code optimization.
In order to access the DevTools, open a web page or web app in Google Chrome. Then select the Chrome menu Chrome Menu at the top-right of your browser window. Thereafter, select Tools > Developer Tools or Right-click on any page element and select Inspect Element. The DevTools window will open at the bottom of your Chrome browser.
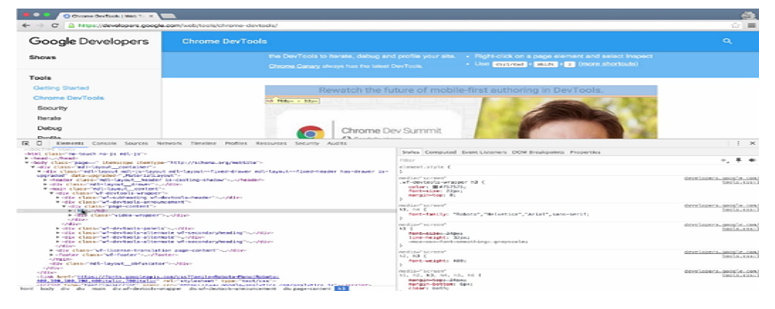
The DevTools are organised into task-oriented groups in the toolbar at the top of the window. Such that each toolbar item and corresponding panel let you work with a specific type of page or app information, including DOM elements, resources, and sources.
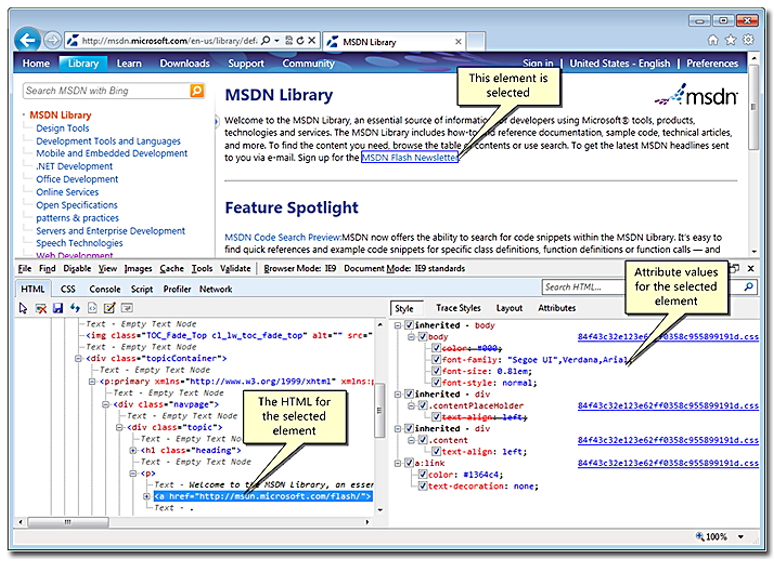
Internet Explorer and Edge
In the same vein, Internet Explorer also has its own Developer Tool that can be used to identify web elements based on their properties within the web page. However, the user is not required to download or install any separate plugin. As the developer tool comes readily bundled with Internet Explorer. In which case, the F12 tools are available on any page you are viewing from within Internet Explorer 9 by pressing F12, or by clicking the tools button of the IE tools button, and then selecting F12 tools. Thereby, F12 tools opens in a separate window, but you can pin it to the page you’re working with by clicking the pin button or pressing Ctrl+P. Primarily, the F12 tools are loosely broken into two areas – Page and Visual Based Tools and Code Level and Debugging Tools.
You can type a specific tag, ID, element, variable, or string into the Search box and press Enter to find that item within a webpage code or details. Further, all found items are highlighted in the current view, and searches can be done on all but the Console tab or console view on the Script tab. However, to find specific elements in a large DOM tree, you can select individual elements in the browser that gets highlighted in the HTML tab of the F12 tools.
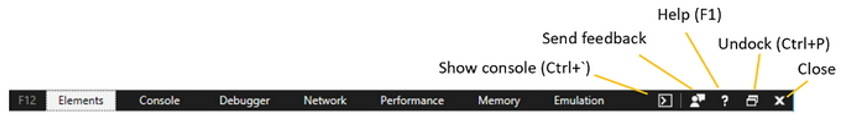
Microsoft Edge Browser
The Microsoft Edge F12 DevTools are built with TypeScript, powered by open source, and optimized for modern front-end workflows.
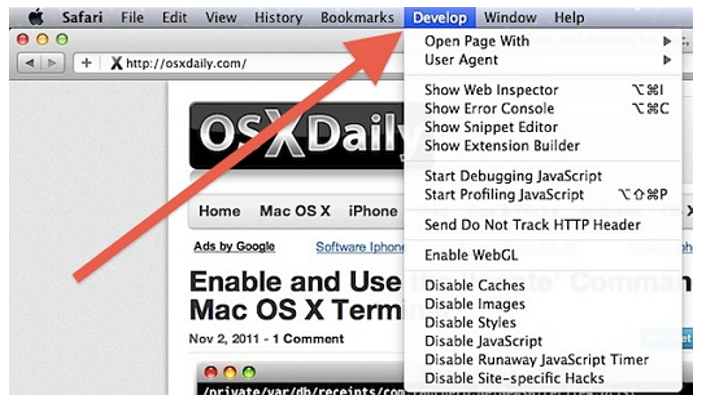
Safari Browser
In order to inspect the elements in Safari Browser, the Safari Develop menu provides tools you can use to make sure your website works well with all standards-based web browsers. In order to access Safari Develop menu , choose Safari > Preferences, click Advanced, then select “Show Develop menu in menu bar.
Mozilla Firefox
In Mozilla Firefox, the Web developer option under Tools menu, offers various tools for web development and testing. For inspecting the elements, the inspector tool is used to examine and modify the HTML and CSS of a page. There are two main ways to open the Inspector
- Without selecting an element : Choose “Tools -> Web Developer -> Inspector” from the Menu Bar or the equivalent keyboard shortcut
- With an element selected: Right-click an element on a web page and select “Inspect Element”
Firebug and FirePath
Both Fire bug and Firepath are plug ins of Mozilla Firefox browser but are not compatible to the new version. Wherein, both are required to be installed from Firefox plug in website and Firefox needs to be restarted. In general, both are used with Selenium IDE to create Selenium tests.
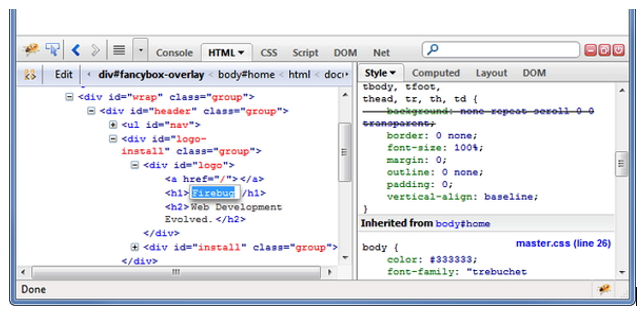
Primarily, FirePath is a Firebug extension used to adds a development tool to edit, inspect and generate XPath 1.0 expressions, CSS 3 selectors and JQuery selectors (Sizzle selector engine).
