Score Cards
Score Cards are one of the most efficient ways to measure the performance of the project team. Therefore, every project manager is responsible to evaluate the performance of the team members and report it to the upper management and HR. Additionally, a comprehensive score card can place the team member in the correct position.
Sections:
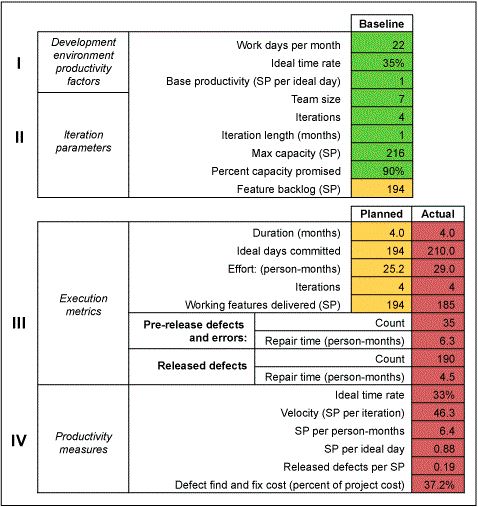
Section I: Development and Environment Productivity Factors
Firstly, workdays per month simply consider weekends and holidays. The ideal time rate traces the time proportion that team members get to focus on and work on. Further, it includes interruptions, other work, meetings on other topics, etc.
Section II: Iteration Parameters
Secondly, team size, iterations, and iteration length evaluate available resources and schedules. Moreover, a percent capacity promised factor may make sense to back off a bit from the maximum, allowing for reality and unforeseen demands. Further, the feature backlog at the end of that scorecard section represents the capacity-based, reasonable promise suggested by this planning section.
Section III: Execution Metrics
After that, duration (month), ideal days committed effort (person-months) and iterations track the planned and actual values for those important project cost and cycle time measures. Working features delivered (SP) measures forecast and actual delivered work product output.
Section IV: Productivity Measures
Lastly, the ideal time rate uses the iteration experience to report the way that ideal time actually worked out as a percent of calendar time.
- Velocity (SP per iteration)– Their bottom line is often related to what they get over a certain interval.
- SP per person-month– tracking the cost associated with delivered functionality.
- SP per ideal day – removing the waste imposed by their work environment and highlighting their productivity.
- Released defects per SP– tracks the rate of defect escape in terms that can be meaningful to the development team and the customer.
- Defect find-and-fix cost (percent of project cost)– brings waste back into the financial view. This number is a stark reminder of the bottom-line costs of poor quality connected with the project.
Get certified and unlock more opportunities. Practice and Validate your skills to become a Certified Agile Testing Professional Now
