The following are the common techniques of inventory control:
- Min-max Plan
- The Two-bin System
- Order Cycling System
- ABC Analysis
- Fixation of various levels
- Use of Perpetual Inventory System and Continuous Verifications
- Use of Control Ratios
- Review of Slow and Non-moving Items.
Min-Max Plan: It is one of the oldest methods of material control. Under this plan the analyst lays down a maximum and minimum for each stock item keeping in view its usage, requirements and margin of safety required to minimize risks of stock-outs. The minimum level establishes the reorder point and order is placed for that quantity of material which will bring it to the maximum level.
The method is very simple and based upon the premise that minimum and maximum quantity limits for different items can fairly be well defined and established. Considerations like economic order quantity and identification of high value and critical items of stock for special management attention are not cared for under this plan.
- The Two-Bin System: The basic procedure used under this system is that for each item of stock, two piles, bundles, or bins are maintained. The first bin stocks that quantity of material which is sufficient to meet its usage during the period that elapses between receipt of an order and the placing of the next order. The second bin contains the safety stock and also the normal amount used from order to delivery date. The moment stock contained in the first bin is exhausted and the second bin is tapped, a requisition for new supply is prepared and submitted to the purchasing department. Since no bin-tag (quantity record of materials) card is maintained, there is absence of perpetual material record under this bin.
- Order Cycling System: In the order cycling system, quantities in hand of each item or class of stock are reviewed periodically say, 30, 60 or 90 days. If in the course of a scheduled periodic review it is observed that the stock level of a given item will not be sufficient till the next scheduled review keeping in view its probable rate of depletion, an order is placed to replenish its supply. Review period will vary from firm to firm and also among different materials in the same firm. Critical items of stock usually require a short review cycle. Order for replenishing a given stock item, is placed to bring it to some desired level which is often expressed in relation to number of day’s or week’s supply.
- ABC Analysis: With the numerous parts and materials that enter into each and every industrial product, material control lends itself, first and foremost, to a problem of analysis. Such analytical approach is popularly known as ABC analysis (Always Better Control), which is believed to have originated in the General Electric Company’ of America. ABC plan is based upon segregation of materials for selection control. It measures the money value, i.e., cost significance of each material item in relation to total cost and material value. The logic behind this kind of analysis is that the management should study each item of stock in terms of its usage, lead time, technical or other problems and its relative money value in the total investment in inventories. Critical, i.e., high value items deserve very close attention, and low value items need to be devoted minimum expense and effort in the task of controlling inventories.
Under ABC analysis, the different items of stock may be ranked in order of their average material investment or on the basis of their annual rupee usage. The important steps involved in segregating materials or inventory control are:
Find out future use of each item of stock in terms of physical quantities for the review forecast period.
- Determine the price per unit for each item.
- Determine the total project cost of each item by multiplying its expected units to be used by the price per unit of such item.
- Beginning with the item with the highest total cost, arrange different items in order of their total cost as computed under step (iii) above.
- Express the units of each item as a percentage of total costs of all items.
- Compute the total cost of each item as a percentage of total costs of all items.
Fixation of Various Levels
Fixation of Norms of Inventory Holdings
Either the top management or by Materials department set the norms for inventories. The top management usually sets monitory limits for investment in inventories. The materials department has to allocate this investment to the various items and ensure the smooth operation of the concern. A number of factors enter into consideration in the determination of stock levels for individual items for the purpose of control and economy. Some of them are:
- Lead time for deliveries
- The rate of consumption
- Requirements of funds
- Keeping qualities, deterioration, evaporation etc
- Storage cost
- Availability of space
- Price fluctuations
- Insurance cost
- Obsolescence price
- Seasonal consideration of price and availability.
- EOQ (Economic Order Quantity), and
- Government and other statuary restriction
Any decision involving procurement storage and uses of item will have to be based on an overall appreciation of the influence of the critical ones among them. Material control necessitates the maintenance of inventory of every item of material as low as possible ensuring at the same time, its availability as and when required for production. A large stock necessarily involves an increased cost of carrying such as insurance, rent handling charges. Under stocking which is other extreme, is equally undesirable as it results in stock outs and the consequent production holds ups. Stoppage of production in turn, cause idle facility cost. Further, failure to keep up delivery schedules results in the loss of customers and goodwill These two extreme can be avoided by a proper fixation of two important inventory level viz, the maximum level and the minimum level. The fixation of inventory levels is also known as the demand and supply method of inventory control. Generally the organization fixes following stock levels:
- Maximum Level: This represents the minimum quantity above which stocks should not be held at any time.
- Minimum Level: This represents the minimum quantity of stock that should be held at all times.
- Danger Level: Normal issues of stock are usually stopped at this level and made only under specific instructions.
- Ordering Level: It is the level at which indents should be placed for replenishing stocks.
- Ordering Quantity: It is the quantity that is ordered.
Maximum Level:
It is normally a matter of policy. The various factors that should be taken into consideration are:
- Capital Outlay: Investment to be made in stores, raw materials and other bulk items is an important consideration.
- Available storage space for material
- Storage and insurance cost of material
- If certain goods are subject to obsolescence, the spare parts and components etc. of such products stocked should be limited.
- Consumption of material periodically i.e. monthly, annually
- Lead time for delivery of material.
- Certain goods are seasonal in nature and can be purchased only during specific period. Hence maximum level will be fixed for each season.
- Price advantage arising out of bulk purchases should be availed.
- The Economic Order Quantity also influences the maximum level.
Maximum stock level can be computed as follows:-
Maximum stock level = Re-order level + Re-ordering quantity – (Minimum consumption x Minimum re-order period).
Minimum Level
The minimum level is also a matter of policy and is based on:
- Consumption of material periodically i.e. monthly, annually
- Lead time for delivery of material
- The production requirement
- The minimum quantity that could be advantageously purchased
- If an item is made to order then no minimum level is necessary
The minimum stock level can be computed as follows:
Minimum level = Re-order level – (Normal consumption x Normal re-order period).
Danger or Safety Level
Material consumption varies from day to day, week to week and hence accurate forecasting is not possible. A safety or reserve stock is kept to avoid stock-out. The desirable safety stock level is that amount which minimizes stock-out costs and also the carrying costs.
This level is a level of stock between the minimum level and nil stock. It is calculated for those items which can be utilized for multiple orders or products. The store-keeper usually does not issue once the danger level is reached. Usually priority is given to some order/product for the use of these items. This level is fixed up especially for control of production so that priority items can be produced.
This level is sometimes fixed above the minimum level. In this case, this level is preventive. If the level is below the minimum level, this level is corrective.
The safety stock level can be computed as follows:
Safety stock level = Ordering level – (Average rate of consumption ´ Re-order period)
OR
(Maximum rate of consumption – Average rate of consumption) ´ Lead time
Ordering Level
The annual consumption of an item and the time lag between ordering and receiving can be collected from past records. Based on these facts and policies, the ordering level and ordering quantity can be calculated, as follows:
Ordering level = Minimum level + Consumption during time lag period
OR
Maximum consumption x Maximum re-order period.
OR
Maximum consumption x Lead time + Safety Stock
The ordering level should be fixed so that when an indent is placed at the ordering level, the stock reaches the minimum level when the replenishment is received. The ordering level is calculated from the following factors:
- The expected usage
- The minimum level
- The lead time
The order point is calculated keeping in mind the worst conditions so that minimum stock is always maintained.
Ordering Quantity or Economic Ordering Quantity
The basic problems of material control are two viz., what quantity of an item should be ordered at a time and when should an order be placed. While deciding economic ordering quantity, the efforts are directed to ascertain the ideal order size. While deciding the ideal order size, factors such as material carrying charges and the ordering cost associated with the placement of purchase orders are to be considered; the total of both has to be minimized. The material carrying charges include interest on the capital invested in the stores of materials, rent for the storage space, salaries and wages of the store-keeping department, any loss due to pilferage and deterioration, stores insurance charges, stationery, etc. used by the stores, taxes on inventories, etc. Ordering costs may include rent for the space used by the purchasing department, the salaries and wages of officers and staff in the purchasing department, the depreciation on the equipment and furniture used by the department, postage, telegraph charges and telephone bills, the stationery and other consumables required by the purchasing department, any travelling expenditure incurred, and the costs of inspection etc., on receipt of material.
The optimum ordering quantity, i.e., the quantity for which the cost of holding plus the cost of purchasing is the minimum is known as Economic ordering Quantity and is calculated by the following formula:
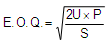
Where,
E.O.Q. = Economic Ordering Quantity
U = Annual consumption (units) during the year
P = Cost of placing an order
S = Annual cost of storage of one unit.
While deciding the question as to what should be the economic ordering quantity one has to ensure that the cost incurred should be minimum. An ideal order size, therefore, is at the quantity where the cost is minimum i.e., cost of holding the stock and ordering cost intersect each other. This is graphically shown hereunder:
Perpetual inventory system and continuous stock verification
The perpetual inventory system is intended as an aid to material control. It is a system of stock control followed by stores department. The system follows a method of recording stores by which information about each receipt, issue and current balance of stock is always available.
Perpetual inventory system comprises of:
- Comparison of Bin Cards (quantitative perpetual inventory) and Stores Ledger Accounts (quantitative-cum-valued perpetual inventory),
- Continuous Stock-Taking (Physical perpetual inventory)
Comparison of Bind Cards and Stores Ledger Account
Bin card is maintained by the store-keeper and stores ledger account is maintained by stores accountant. Each item of stores is recorded at these places simultaneously. Normally the balances shown by the two records tally However, th6re may arise some differences between these two records due to the following reasons:
- Omission of an item of store in bin card or stores ledger account
- Wrong posting of an item of store either in bin card or in stores ledger account
- Arithmetical error in working out their balances Therefore, the balances of the two records should be reconciled at frequent intervals and correct balances should be drawn.
Physical Stock Verification
The perpetual inventory system is not complete without a systematic procedure for physical verification of stores. The correctness of balances as shown in the bin card or stores ledger account should be verified by means of physical stock verification. Physical stock verification may be conducted in the following two ways: Periodic stock verification Continuous stock verification
- Periodic stock verification: It refers to a system where physical stock verification is normally done periodically, i.e., once or twice in a year. Under this method, value of stock is determined by physical counting of the stock on a particular date, usually at the end of the year.
- Continuous stock verification: This system comprises of counting and verifying i number of items at random daily throughout the year so that all items of stores are verified several times during the year. Notice of the particular stock to be verified each clay is given to the store-keeper only on the date of actual verification.
Advantages of Perpetual Inventory System
- Easy detection of errors – Errors and frauds can be easily detected at an early date. It helps in preventing their occurrence.
- Better control over stores- The system exercises better control over all receipts and issues in such a manner so as to give a complete picture of both quantities and values of stock in hand at all times.
- No interruption of production process- Production process is not interrupted as the physical verification of stock is made on a planned and regular basis.
- Acts as internal check- Under the system, records are made simultaneously in the bin cards and stores ledger accounts which acts as a system of internal check for detection of errors as and when they are committed.
- Investment in materials kept under control – The investment in materials is kept at a minimum level as the actual stock is continuously compared with the maximum level and minimum level.
- Early detection of loss of stock- Loss of stock due to shrinkage, evaporation, accident, fire, theft, etc. can be easily detected.
- Accurate and up-to-date accounting records- Due to continuous stocktaking, the store-keeper and stores accountant become more vigilant in their works and they maintain accurate and up-to-date records.
- Easy to prepare interim accounts- It is possible to prepare periodical profit and loss account and balance sheet without physical stock-taking being made.
Availability of correct stock data- Correct stock data is readily available for settlement of insurance claims.
Disadvantages of excessive Stock
The following disadvantages of excessive stock are avoided:
- Loss of interest on capital locked up in stock
- Loss through deterioration
- Risk of obsolescence
- Employment of specialized staff – Since the work is spread throughout year, whole time specialized staff can be engaged for the purpose.
- Moral check on employees – The system acts as a moral check on the employees working in the stores which increases their efficiency.
Such losses increase the cost of production. These losses may be in the form of wastage scrap, defective and spoilage. The problems of waste, scrap, spoilage or defectives materials must arise in almost all manufacturing industries. There is no uniformity the meaning and accounting treatment of waste, scrap, spoilage and defective However, steps should be taken to minimize the discrepancy so that efficiency can increase and proper material control is ensured.
Bin Card
A bin card is a quantitative record of receipts, issues and closing balances of items of stores. Each item is accompanied by a separate bin card. The bin card is posted as and when a transaction takes place. Only after the transaction is recorded, the items are received/issued. On receipt of materials, the quantity is entered in the bin card from the goods received note in the receipt column and the issues to various departments in the issue column. The balance quantity is calculated and recorded.
The various levels indicated in a bin card enable the store-keeper to requisition materials as and when required. Sometimes quantity on order and quantity reserved is also noted separately.
| Code No.: Description: Unit of Quantity: Location Code: | Level of Stock Maximum: Minimum: Danger: Ordering: Ordering Qty |
| Date | Doc. No. | Receipts | Issues | Balance | On Order | Reserved |
Stores Ledger
The store ledger is maintained to record all receipt and issue transactions in respect of materials. The quantities and the values are entered in the receipts, issues and balance columns. Additional information regarding quantity on order and quantity reserved may be recorded. Separate sheets for each item or continuous stores ledger may be maintained. The sheets should be serially numbered to obviate the risk of removal or loss.
| Code No Description Substitute: . | Location Code: Maximum Level: Minimum Level: Danger Level: Ordering Level:Ordering Quantity: | Suppliers’ Name 1. 2. 3 |
| Date | Receipts | Issues | Balance | On Order | Reserved | ||||||||||
| Doc. No. | Qty. | Rate | Value | Doc. No. | Qty. | Rate | Value | Qty. | Rate | Value | P.O. No. | Qty. | G.R. No. | Qty. | |
Stores Ledger
Reconciliation of Bin Card and Stores Ledger
Though there should not be any difference between the balances shown in the Bin Card and Stores Ledger, differences may arise due to the following reasons:
- Arithmetical error in working out the balances.
- Posting in the issue column when it should have been posted in the receipts column.
- Non-posting of a voucher either in the Bin Card or the Stores Ledger.
- Posting in the wrong Bin Card or Stores Ledger sheet.
- Material may be issued or received on loan/approval. They may be entered in the Bin Card for the purpose of record. These transactions do not find a place in Stores Ledger.
The differences should be reconciled at regular intervals.
Continuous Physical Stock Verification
The stores accounts reveal what the balances should be and a physical verification reveals the actual stock position.
Under this system of verification, the total number of man-days available for verification is calculated. The items to be verified per man-day are selected by classifying the various items into groups depending upon the time required. The stock verification staff plans the programme and divides the work among them. The plan is such that all the items are verified in the year. Items of small value may be verified twice or more in a year. Bulky items are usually verified when stocks are comparatively low.
There is an element of surprise and sometimes the stock verifier knows of the items to be verified only on the actual date of verification. Stock not recorded should not be mixed up with the stock. After counting or weighing the results are recorded.
Reasons for Surpluses and Deficiencies in Stock-taking and Accounting thereof
Differences in stock arise occasionally. The difference in the stock verification sheet should be verified with the bin card balance. There may be differences between the Stores Ledger and the Bin Card. But the Bin Card reflects the stock in hand and hence no adjustment is needed. The balance in Stores Ledger and Bin Card should be reconciled first.
A surplus/deficiency should be kept at the minimum. A deficiency may be due to malpractices in stores while surplus may encourage malpractices. Wherever possible preventive measures should be taken to prevent their recurrence in future
The difference may be analyzed as follows
SURPLUS OR DEFICIENCY
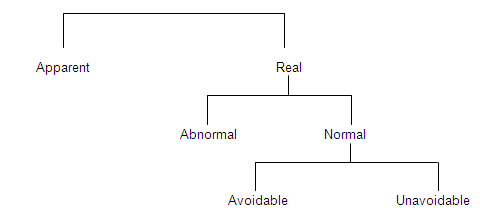
If there is difference between the Bin Card and physical stock, it may be due to clerical mistake in posting and casting in the Bin Card or due to inaccuracies in measuring standards and conversion ratios used. This difference is apparent and either the Bin Card has to be corrected or the stocks re-verified.
The first stage of analysis is to distinguish between the differences due to normal and abnormal causes. Differences are abnormal when they are beyond the control of the stores management and hence written off, e.g., fire, riot, burglary, etc. If the differences are due to normal causes, the stores management should take effective steps to prevent them.
Differences due to normal causes may be avoidable or unavoidable. Some of the avoidable causes are:
- Incorrect measurement of issues
- Carelessness in material handling
- Improper storage of material
- Pilferage, theft etc.
- Stores misplaced
- Errors in stock-taking.
The storekeeper is responsible for all differences arising out of avoidable causes and he should ensure that adequate steps are taken to reduce and eliminate the differences. Sometimes, even though the store keeping is efficient, some surplus or deficiency occurs. These are called unavoidable. The storekeeper should be able to foresee the nature, the magnitude of the differences and lay down proper accounting methods.
Some of the unavoidable causes are:
- Handling losses arising out of issuing in small units, e.g., starch powder in bags.
- Loss or gains arising out of atmospheric conditions; certain chemicals gain in weight and others lose weight.
- Gains that arise due to seasoning and preservation of materials when specially processed, e.g., wooden and leather items are seasoned in oil.
Accounting of Surpluses and Deficiencies
- Apparent differences need no adjustment. Either the Bin Card is corrected or the stocks are re-verified.
- Differences due to abnormal causes are written off to profit and loss account and do not form part of manufacturing cost.
- Differences due to avoidable causes should be valued and adjusted through the stores consumption account and recovered in cost as an item of stores overhead expenses.
- Differences due to unavoidable causes get accounted for as a part of the material cost itself. Through past observations, the loss or gain percentage is worked out. Whenever material is issued, adjustment is made by this percentage. Stocks are adjusted in a similar manner. This percentage should be reviewed and corrected periodically.
Any difference between the anticipated and actual difference is noted on a stores adjustment note and the difference is transferred to overhead or the Costing Profit and Loss Account or Profit and Loss Account as the case may be.
Use of Control Ratio
Inventory turnover ratio: It helps management to avoid capital being locked up unnecessarily. This ratio reveals the efficiency of stock-keeping.
Inventory turnover ratio is given by the formula =
Cost of material consumed
Cost of average stock held during the period
Cost of average stock = (Cost of opening stock + Cost of closing stock)/2
The inventory turnover ratio can be calculated (in days) as follows: (Days during the period) / Inventory Turnover ratio
This will reveal the number of days for which the stocks are held.
Input-output Ratio: It is the ratio of the quantity of input of material to production. This ratio enables comparison of actual consumption and standard consumption, indicating whether the usage of material is favorable or adverse.
Review of slow and non-moving items
The money locked up in inventory is money lost to the business. If more money is locked up, lesser is the amount available for working capital and the cost of carrying inventory also increases.
Stock turnover ratio should be as high as possible. Loss due to obsolescence should be eliminated or these items used in some profitable work. Slow moving stocks should be identified and speedily disposed of. The speed of movement should be increased. The turnover of different items of stock can be analyzed to find out the slow moving stocks.
Materials become useless or obsolete due to changes in product, process, design or method of production, slow moving stocks have a low turnover ratio. Capital is locked up and cost of carrying have to be incurred. Hence management should take effective steps to minimize losses.
