Six Sigma is the most popular strategy used for statistical quality assurance. The strategy uses data and statistical analysis in order to measure and improve company’s overall operational performance, it also helps to identify and eliminate defects in manufacturing and service-related processes. Six Sigma is basically a tool used by the organizations to enhance the capability of their business processes. This progress in business processes is caused due to increase in performance and decrease in process variation that ultimately leads to defect reduction and improvement in profits, increased employee morale, and further improving quality of products or services.
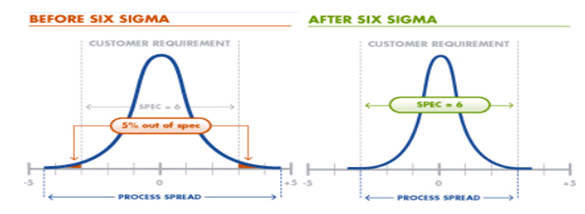
Six sigma does not only refer to improvement in quality but also offers better value to customers, investors and employees. Six Sigma can also be referred as a business initiative which aims to improve the quality and productivity, thereby increasing competitiveness and reduced cost. In six sigma by controlling the variation within the specified upper and lower limits of a process, the frequency of out of control conditions reduces. Six sigma as part of business reduces errors, identifies and corrects variations in the eprocesses and improves the rate of success of the organization.
Four groups of quality costs
- External failure cost such as warranty claims, service cost
- Internal failure cost such as the costs of labor, material associated with scrapped parts and rework
- Cost of appraisal and inspection such as materials for samples, test equipment, inspection labor cost, quality audits, etc..
- Cost related to improving poor quality such as quality planning, process planning, process control, and training.
Aim of Six Sigma approach
- Increased customer satisfaction
- Compressing the cycle time of production
- Reducing defects and eliminating waste resulting in substantial cost savings
Steps involved in the process of Six Sigma methodology
- Map core processes
- Identify key customers
- Align processes to critical customer requirements
- Install measurement and analysis systems to continuously improve processes
At the heart of Six Sigma is a systematic method for business improvement called DMAIC.
Five phases of DMAIC model
- Define opportunities
- Measure performance
- Analyze opportunity
- Improve performance
- Control performance
Differentiate between Six Sigma and TQM
Table summarizes the key differences between Six Sigma and Total Quality Management (TQM)
| Basis of Distinction | Six Sigma | Total Quality Management |
| Orientation | Executive ownership | Self-directed work teams |
| Execution | Business strategy execution system | Quality initiative |
| Functionality | Truly cross functional | Largely within a single function |
| Training | Focused training with verifiable return | No mass training in statistics and quality |
| Orientation | Business results oriented | Return on investment Quality oriented |
Features of Six Sigma
- Six Sigma is customer focused.
- Six Sigma generates major quantifiable returns on investment.
- Six Sigma changes the overall management operations by introducing new ways of thinking, planning and executing to achieve the desired results..
Six Sigma Toolkit
List of key tools and techniques employed in implementing and executing Six Sigma projects. These tools are grouped in five broad categories namely,
- Tools for Generating Ideas and Organizing Information
- Brainstorming
- Affinity diagramming
- Multivoting
- Structure Tree
- High-level Process Map
- Flowchart
- Cause-And-Effect Diagrams
- Tools For Data-Gathering
- Sampling
- Operational Definitions
- Voice of the Customer methods such as
- Market research
- Requirement analysis
- Data warehouses
- Data mining
- Check sheets and Spreadsheets
- Measurement Systems Analysis
- Tools for Process And Data Analysis
- Process-Flow Analysis
- Value and Non-Value Added Analysis
- Charts and Graphs
- Pareto Chart
- Histogram
- Trend Chart
- Scatter Diagram
- Tools for Process and Data Analysis
- Tests of statistical significance such as
- Chi-square
- T-tests
- Analysis of variance (ANOVA)
- Correlation and Regression
- Design of Experiments (DOE)
- Tools for Implementation and Process Management
- Project Management techniques like
- Gantt charts
- PERT
- CPM
- Failure Mode and Effects Analysis
- Stakeholder Analysis
- Control Charts
- Force Field Diagram
- Process Documentation
- Balanced Scorecards and Process Dashboards
Six Sigma is referred as six standard deviations (i.e., 3.4 defects per a million opportunities). In general, the companies operating are at 3 Sigma level translates to 25 – 40% of annual revenue being taken by cost of quality. In case a company improves its quality by 1 sigma level, then its net income increases hugely, approximately by 10 percent net income improvement.
So as and when the level of process complexity increases (like the output of one sub-process feeds the input of another sub-process), then the rolled throughput yield of the process decreases, leading to a fall in the final outgoing quality level causing an increase in cost of quality. In this case, the project teams with well-defined projects helps to improve the company’s profits.
Five steps of six sigma
- Define (D): Define Customer requirements, deliverables, and project goals with the help of well-defined methods of customer communication
- Measure (M): Measure the existing process and its output to determine current quality performance (e., collect defect metrics)
- Analyze (A): Analyze defect metrics and determine the vital few causes (the 20%)
- Improve (I): Improve the process by eliminating the root causes of defects
- Control (C): Control the process to ensure that future work does not reintroduce the causes of defects
Tools for applying Six Sigma
- Run Chart: Run chart is used to identify when business processes involved in software development are not behaving according to specifications
- Pareto Analysis: Pareto Analysis is used to find 20% of the causes, resulting in 80% of the quality problems
- Checksheet: Checksheet is used to keep track of defects or used to make sure people collect data in a correct manner
- Histogram: Histogram is used to identify the frequency of quality defect occurrence and display quality performance
- Ishikawa Diagram: It is used to systematically track backwards to find a possible cause of a quality problem (or effect)
Statistical Six Sigma Definition
In layman terms – Six Sigma simply means a measure of quality that aims for near perfection. But as per the statistical implications of a Six Sigma program is much more than qualitative eradication of customer-identifiable defects. The main purpose of Six Sigma quality is to reduce process output variation, such that on a long term basis, the customer’s aggregated experience with the companies process results in no more than 3.4 defect parts per million (PPM) opportunities (or 3.4 Defects Per Million Opportunities – DPMO). So for a process with only one specification limit (either upper or lower), results in six process standard deviations between the mean of the process and the customer’s specification limit (hence, making it Six Sigma). Similarly, for a process with two specification limits (upper and lower), this translates to slightly more than six process standard deviations between the mean and each specification limit such that the total defect rate corresponds to equivalent of six process standard deviations.
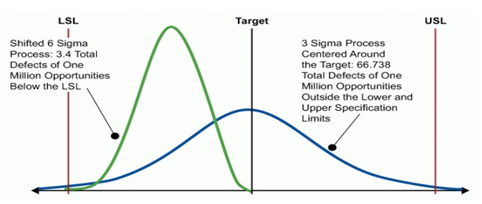
In an organization, many processes are being influenced by special and/or assignable causes which affect the overall performance of the process relative to the customer’s specification. So the overall performance of the process as customer views should be 3.4 DPMO (with reference to long term performance of 4.5 sigma). However, the process could also be capable of producing a near perfect output (Also referred as Short Term capability –known as process entitlement – of Six Sigma).
Here, the difference between the best a process can be, measured by short term process capability, and the aggregate customer’s experience (which is a part of long term capability) is known as Shift depicted as Zshift or Sshift. So for a typical process, the value of shift is 1.5, the short term capability of the process is 6, the long term capability is 4.5 (3.4 DPMO – as per the customer) with an assumed shift of 1.5. Ideally, when reference is given using DPMO, it indicates the long term capability of the process, which denotes the customer’s experience. Here the role of the Six Sigma professional is to quantify the process performance (including short term and long term capabilities) which are based on the true process entitlement and process shift, establish the right strategy to reach the established performance objective.
Note, as the process sigma value increases from zero to six, the variation of the process around the mean value decreases. Therefore, with a high enough value of process sigma, the process approaches zero variation and is known as ‘zero defects.’
Six Sigma – Mathematical Implication
Six Sigma have been taken from the statistical discipline known as process capability studies. Where, Sigma is represented by the Greek alphabet ‘σ’, stands for standard deviation from the ‘mean’. Six Sigma represents six standard deviations from the ‘mean.’ This indicates that if a company produces 1,000,000 parts/units, and the processes are at Six Sigma level, this means less than 3.4 defects only.
Table below shows the number of defects observed for every 1,000,000 parts produced (also known as defects per million opportunities or DPMO).
| Sigma Level | Defects per million opportunities |
| Two Sigma | 308,507 DPMO |
| Three Sigma | 66,807 DPMO |
| Four Sigma | 6,210 DPMO |
| Five Sigma | 233 DPMO |
| Six Sigma | 3.4 DPMO |
Note, the process standard deviation (σ) should be so minimal that the process performance should be able to scale up to 12σ within the customer specified limits. So, no matter how widely the process deviates from the target, it must still deliver results that meet the customer requirements.
Important terminologies
- USL – Represents upper specification limit for a performance standard.
- LSL – Represents lower specification limit for a performance standard.
- Target – Target ideally will be the middle point between USL and LSL.
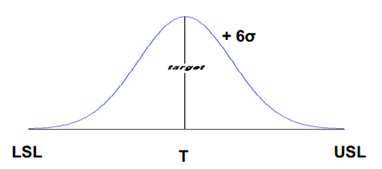
Note, any deviation above the USL or below LSL will lead to a defect.
The Six Sigma approach focuses on finding the root causes of the problem, represented by
Y = F(X).
Where, Y represents the problem that occurs due to cause (s) X.
| Y | x1, x2, x3, …., xn |
| Dependent | Independent |
| Customer related output | Input-process |
| Effect | Cause |
| Symptom | Problem |
| Monitor | Control |
Benefits of Six Sigma
- Aims at continuous defect reduction in products and/or services
- Aims to improve customer satisfaction
- Aims to enhance performance dashboards and metrics
- Aims to achieve process sustenance
- Aims to achieve project based improvement, with visible milestones
- Aims to achieve sustainable competitive edge
- Helpful in making right decisions
